HomeMicrosoft OfficeExcelHow to Create a Chart Sheet in Excel?

How to Create a Chart Sheet in Excel?

In this post, you’ll learn about Chart Sheet in Microsoft Excel and how to create a new chart sheet in excel.

Chart Sheet in Microsoft Excel is a worksheet that contains only Charts so that it provides a clear view of data in that chart.

How to Create a Chart Sheet in Excel?

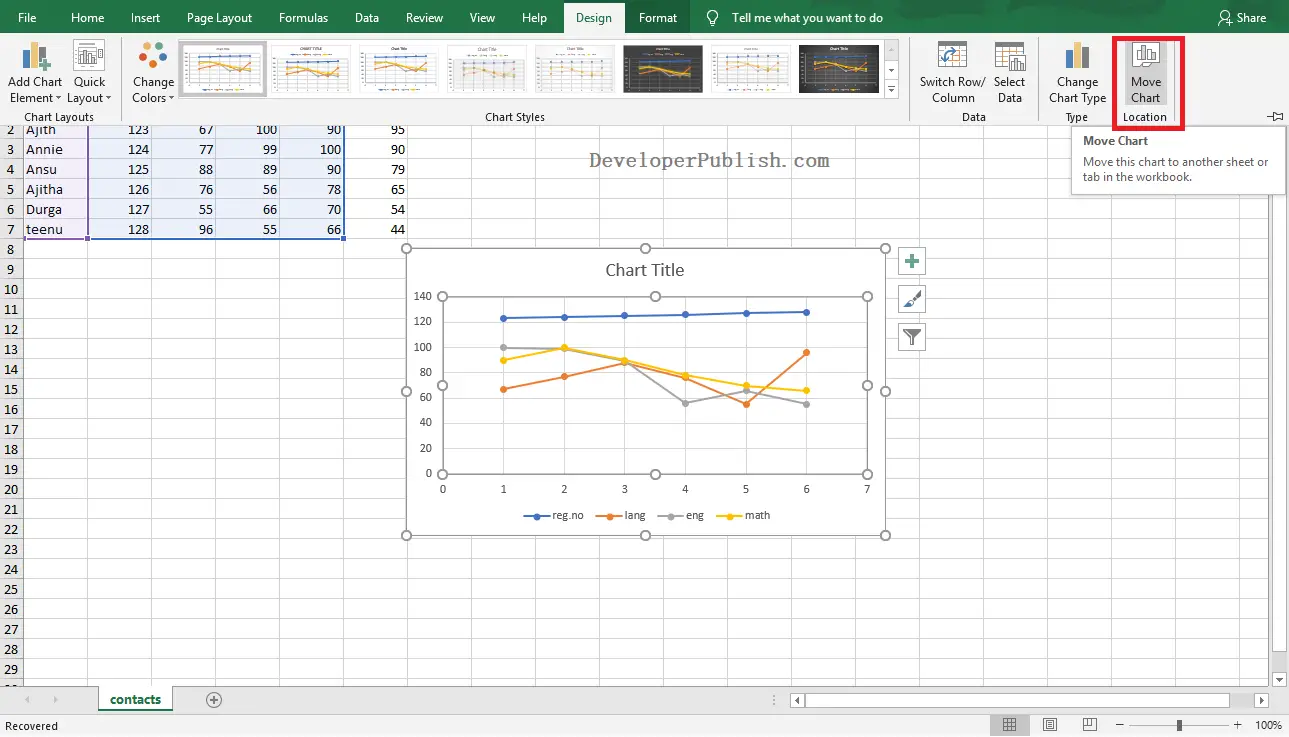
  • To get started, select the chart that we want to view in your chart sheet.
  • Now, go to Design Tab in the ribbon.
  • Then, click on the Move Chart option in the Location group.
How to Create a Chart Sheet in Excel?
  • The Move Chart dialog box will appear as shown in the below image.
How to Create a Chart Sheet in Excel?
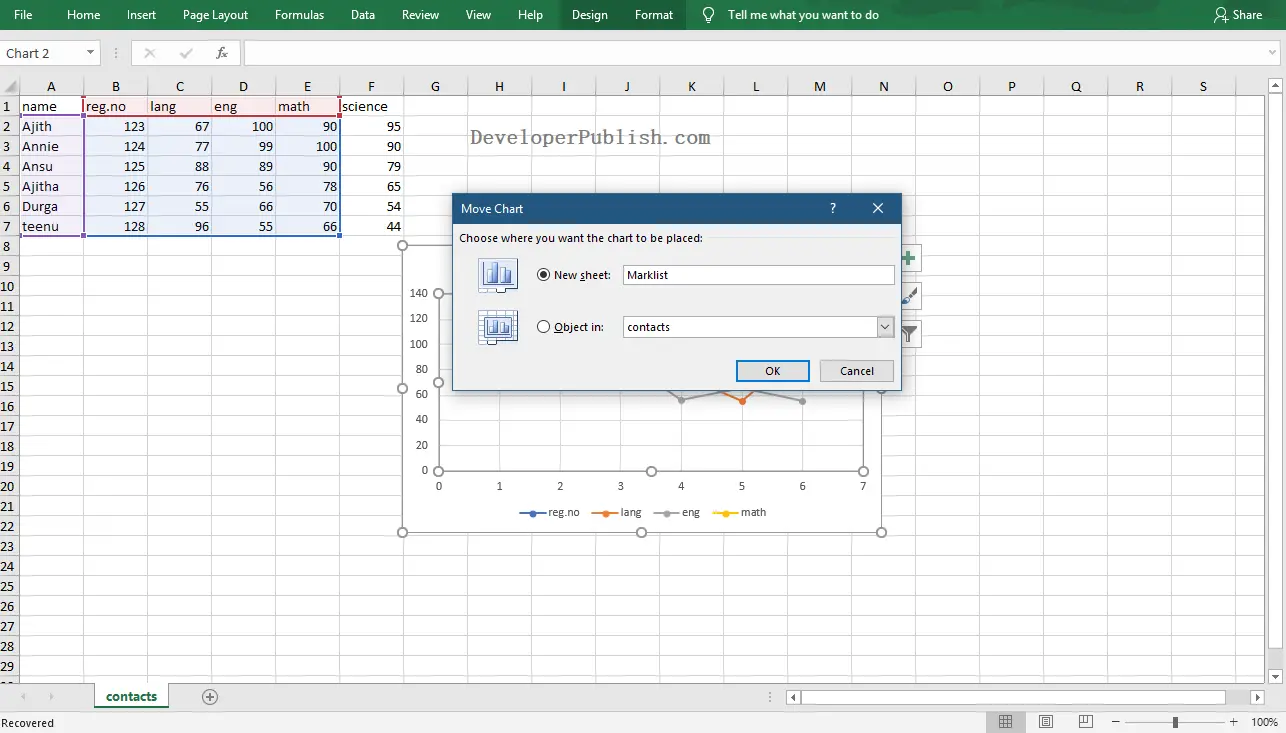
  • Enter the name for the chart sheet and click the Ok button.
How to Create a Chart Sheet in Excel?

Now, we can view the created Chart Sheet on the worksheet as in the above image.

Leave A Reply

Your email address will not be published. Required fields are marked *

You May Also Like

In this article, you will learn about the SKEW.P function, the formula syntax and usage of the function in Microsoft...
In this article, you will learn about the SKEW function, the formula syntax and usage of the function in Microsoft...
In this article, you will learn about the RANK.EQ function, the formula syntax and usage of the function in Microsoft...
  • Excel
  • November 23, 2021