HomeMicrosoft OfficeExcelHow to Draw a Flowchart in Excel?

How to Draw a Flowchart in Excel?

In this article, you’ll get to know about Illustrations in Excel and how you can draw a flowchart in Excel.

How to Draw a Flowchart in Excel?

Go to the Insert tab , under the Illustrations group, select Shapes.

How to Draw a Flowchart in Excel?

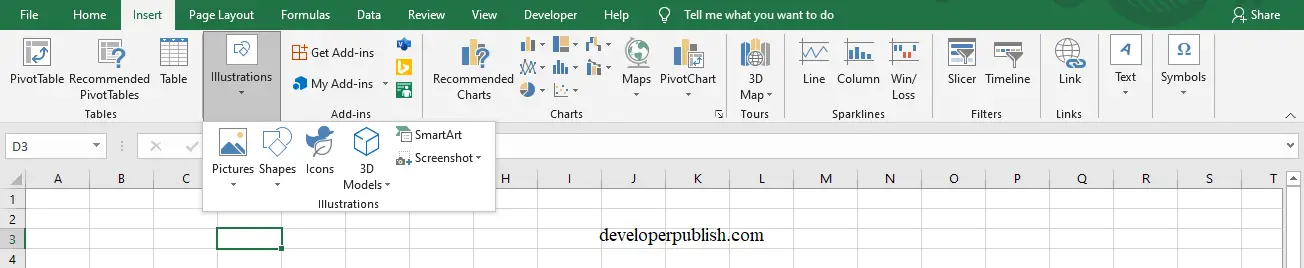
In shapes, scroll down to select a shape under Flowchart category.

How to Draw a flowchart in Excel?

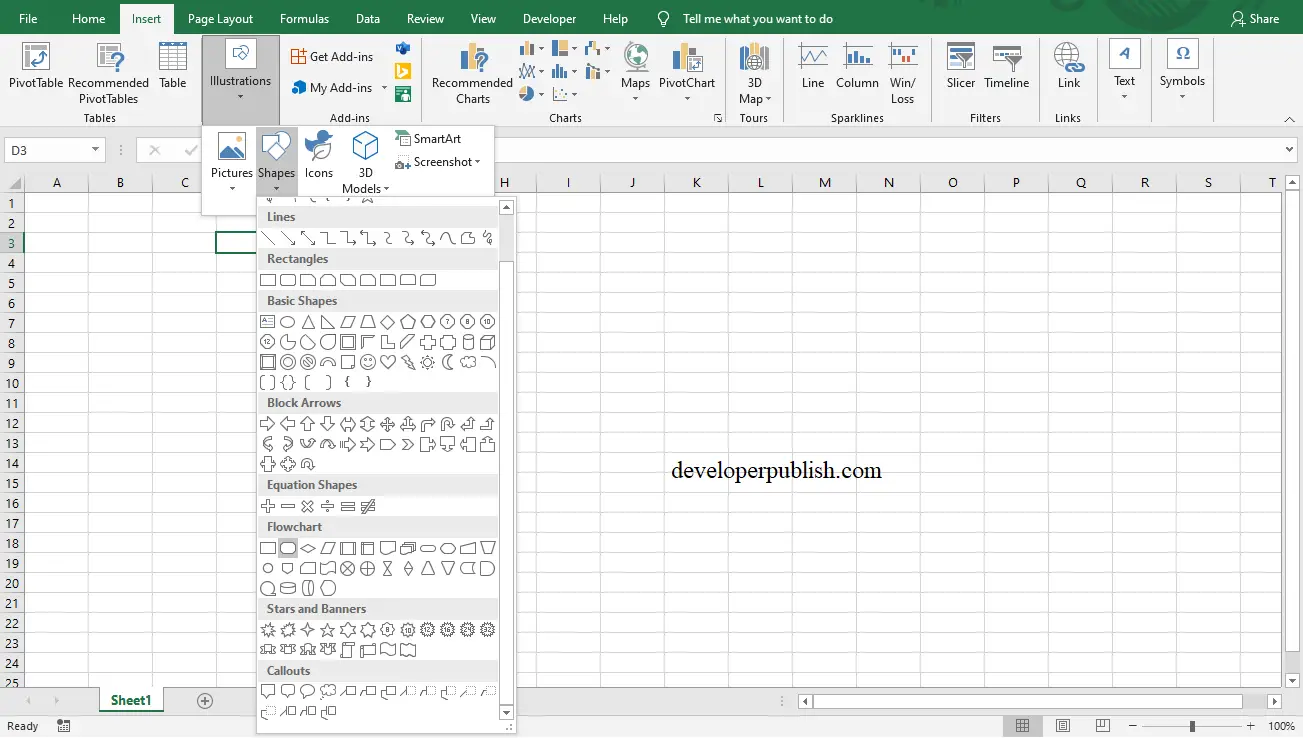
After drawing shapes to insert text double click on the shape, to draw lines or arrows to connect them use Lines or arrows under the Lines category.

How to Draw a flowchart in Excel?

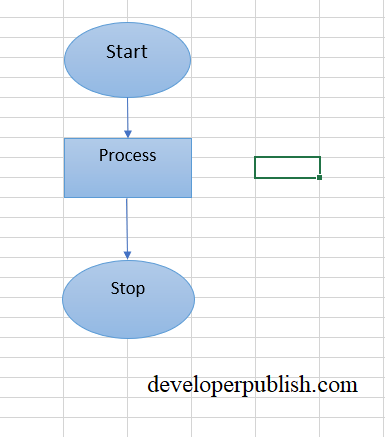
This is how you draw a flowchart in Excel.

Leave A Reply

Your email address will not be published. Required fields are marked *

You May Also Like

In this article, you will learn about the SKEW.P function, the formula syntax and usage of the function in Microsoft...
In this article, you will learn about the SKEW function, the formula syntax and usage of the function in Microsoft...
In this article, you will learn about the RANK.EQ function, the formula syntax and usage of the function in Microsoft...
  • Excel
  • November 23, 2021