TrendLine in Excel
In this post, you’ll learn what is Trendline in Microsoft Excel and how to add a trendline to the chart in the excel worksheet
A Trendline in Excel is a straight or curved line that shows the overall direction of the data in a chart. It is also known as Line of Best Fit. It is the best tool for traders because it helps in determining the likelihood that the trend will continue.
How to Add TrendLine to a Chart?
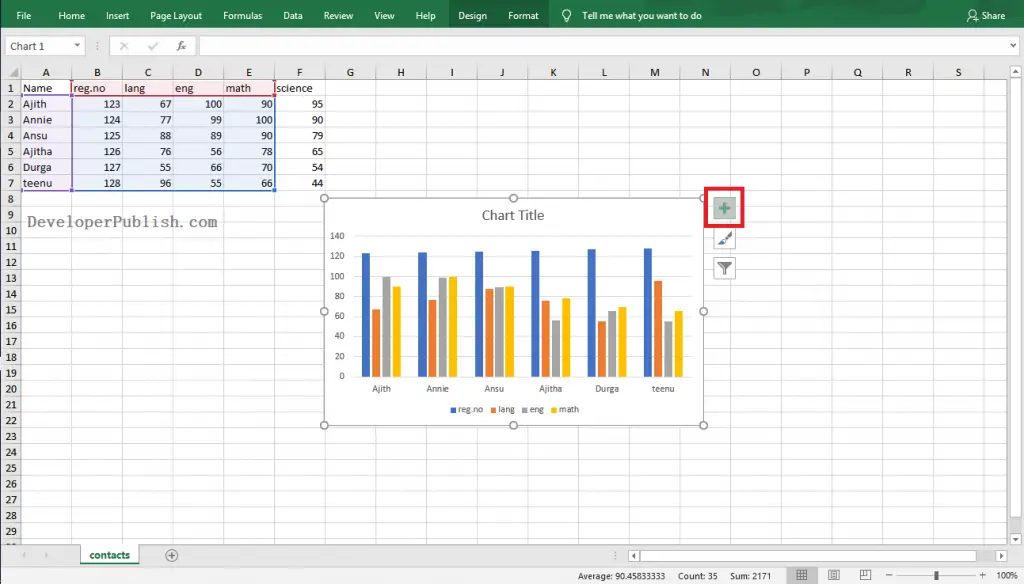
- To get started, select the chart to add a trend line by clicking on that.
- Click the + button which appears at the side of the chart.
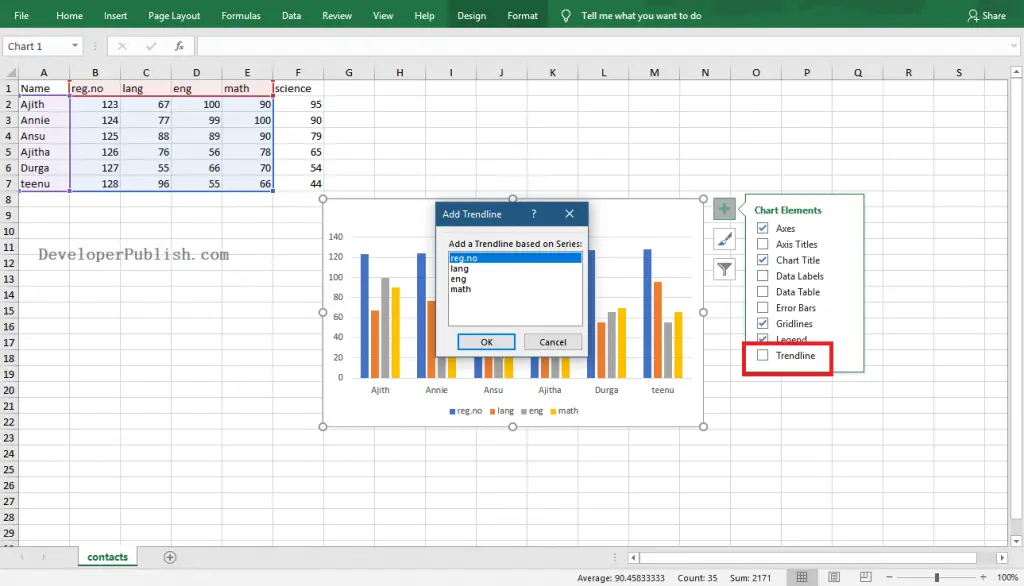
- Now, select the Trendline option from the menu.
- The Add Trendline dialogue box will appear on the screen.
- Select the data series to add a trendline and click the Ok button.
Now you can see the created trendline for the selected data series in the chart.


Leave a Review