In this article, you will get to know in steps on how to plot data series in a Microsoft Excel worksheet?. Sometimes, you may need to add another row or column of data series to the chart. Microsoft Excel makes this task simple and easy.
How to plot data series to an existing Chart?
To plot another set of data in your chart, follow the below-mentioned steps:
- Click on the chart that need to be updated in the Excel Worksheet.
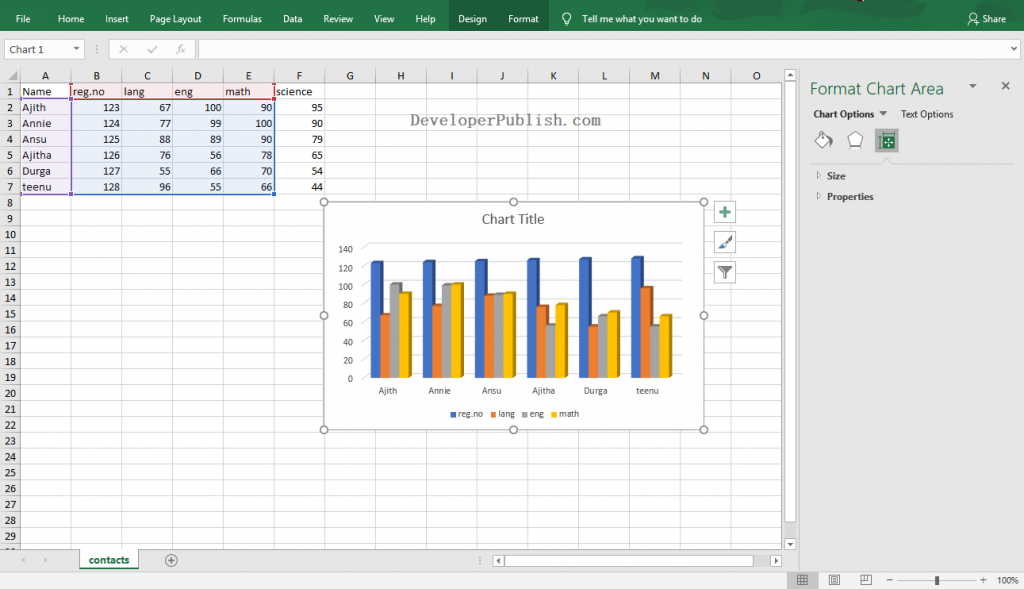
- Use the handles to include the additional data series in the chart.
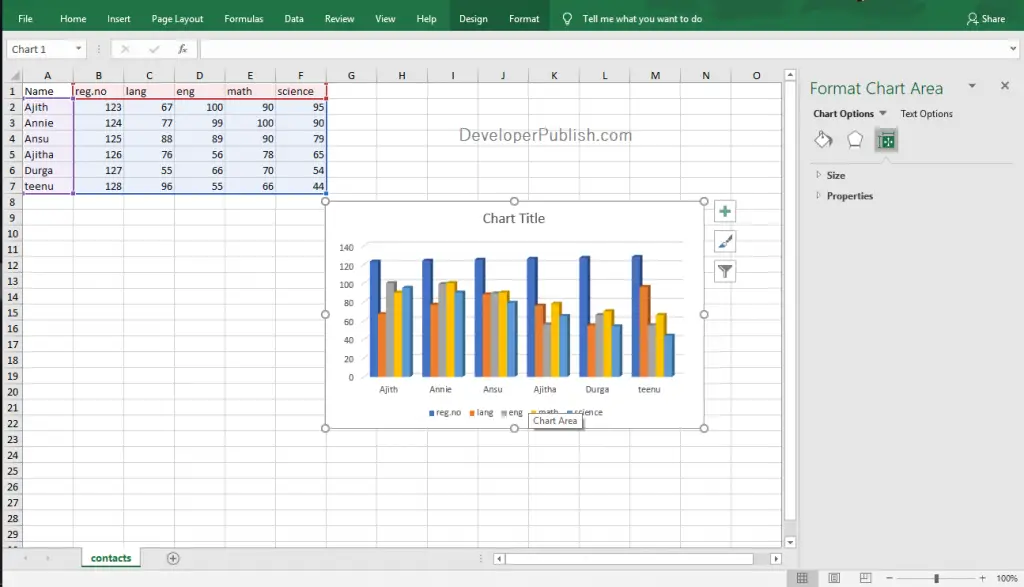
- Microsoft Excel will automatically update the changes and add the select data series to the chart as in the above image.
How to plot data series in a separate Chart?
To plot the additional data series in a separate chart in the Excel Worksheet, follow the below-mentioned steps:
- Add the data series next to the existing data and select it.
- Go to the Insert tab and select the desired chart type from the Charts group by clicking on it.
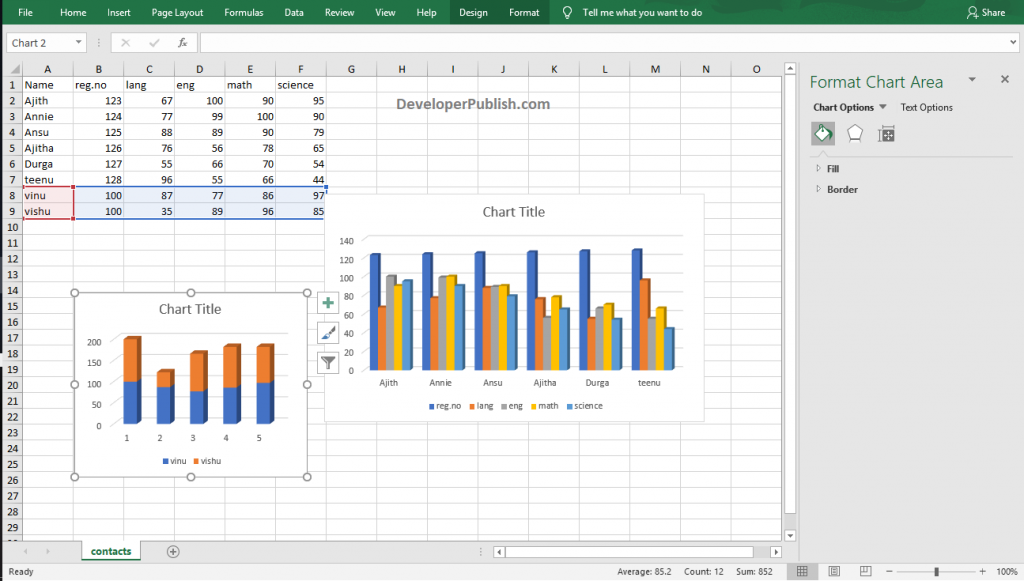
- Now, you can see the embedded chart as in the above image. Use the handles around the chart to move and resize the chart.

