This post explains in simple steps on what is linked excel chart and how you can insert linked Excel chart in PowerPoint.
What is Excel chart?
A chart is a tool you can use in Excel to communicate data graphically. Charts allow your audience to see the meaning behind the numbers, and they make showing comparisons and trends much easier.
How to insert linked Excel Chart in PowerPoint?
The following are the steps to insert a linked Excel chart in PowerPoint, and they are:
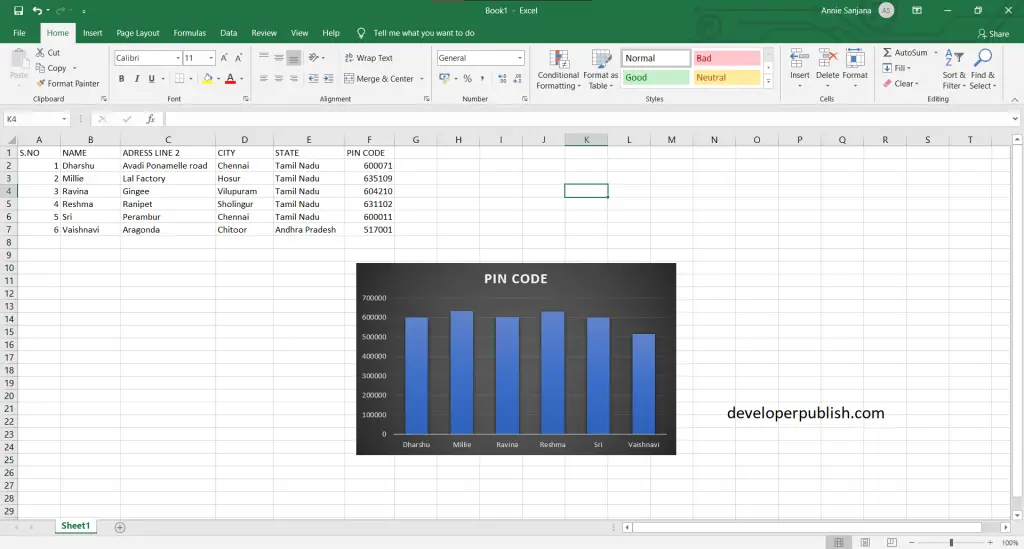
- First, create an Excel chart sheet with some data in it.
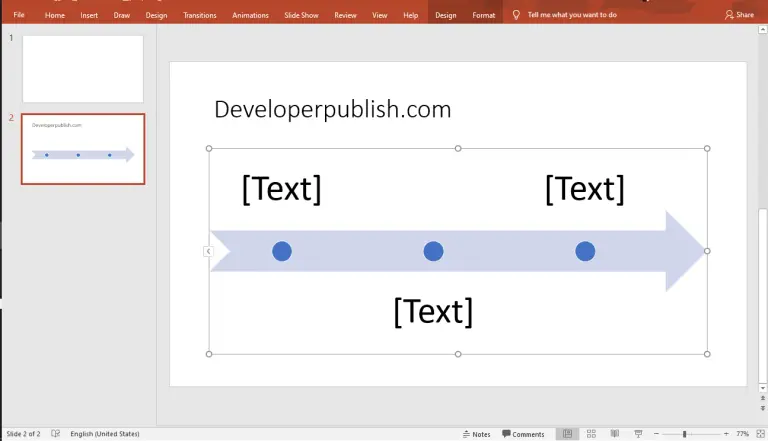
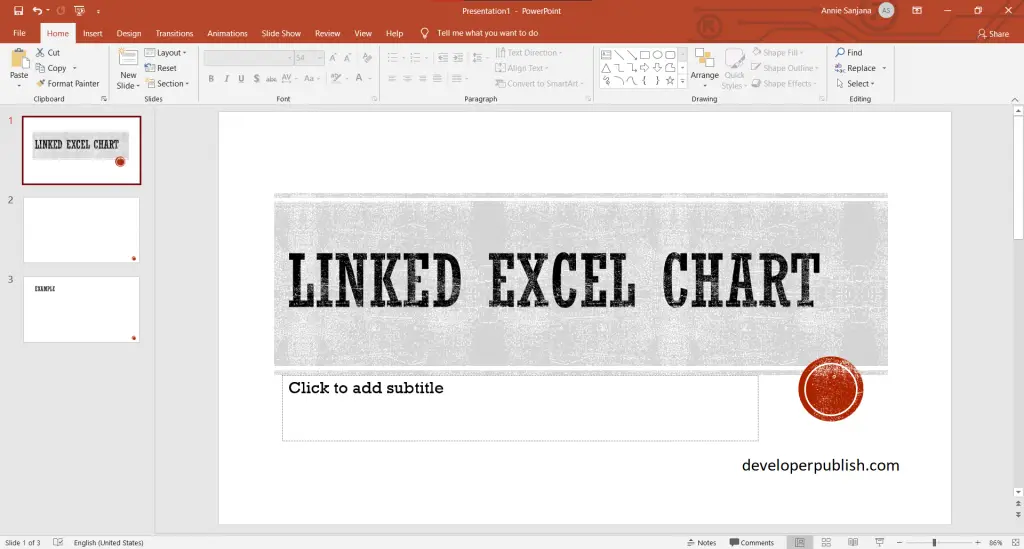
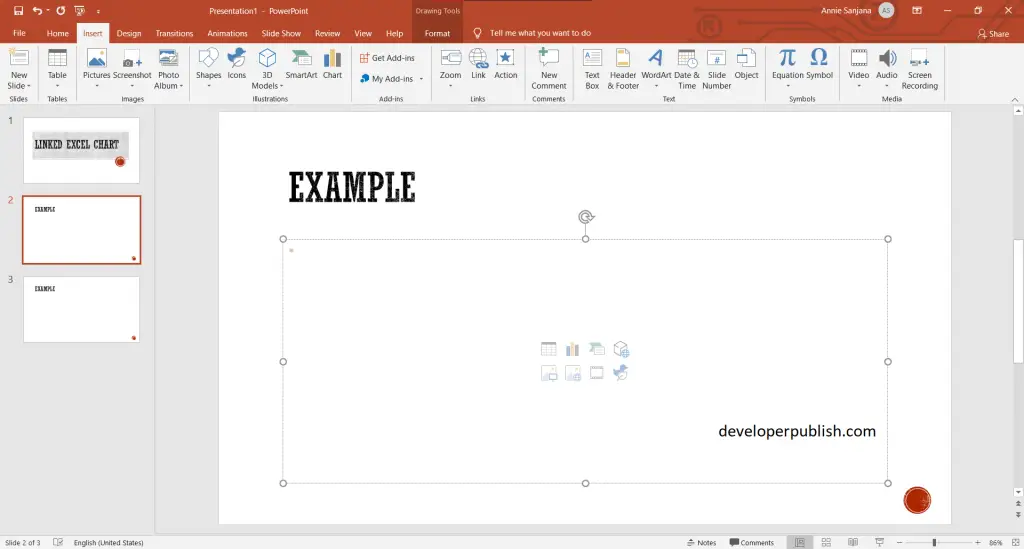
- Now create PowerPoint presentation with the required number of slides.
- Click on insert tab > then to object.
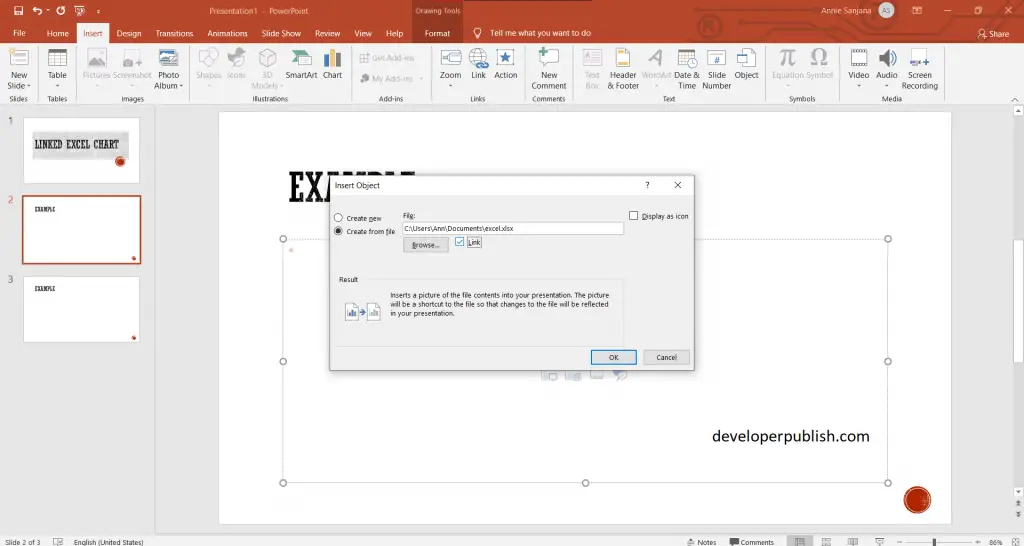
- After selecting the object option, a dialog box appears, where you can attach the link of the excel chart sheet.
- An Insert Object dialog box pops up, click Create from file option > then on browse > then tick on the link option.
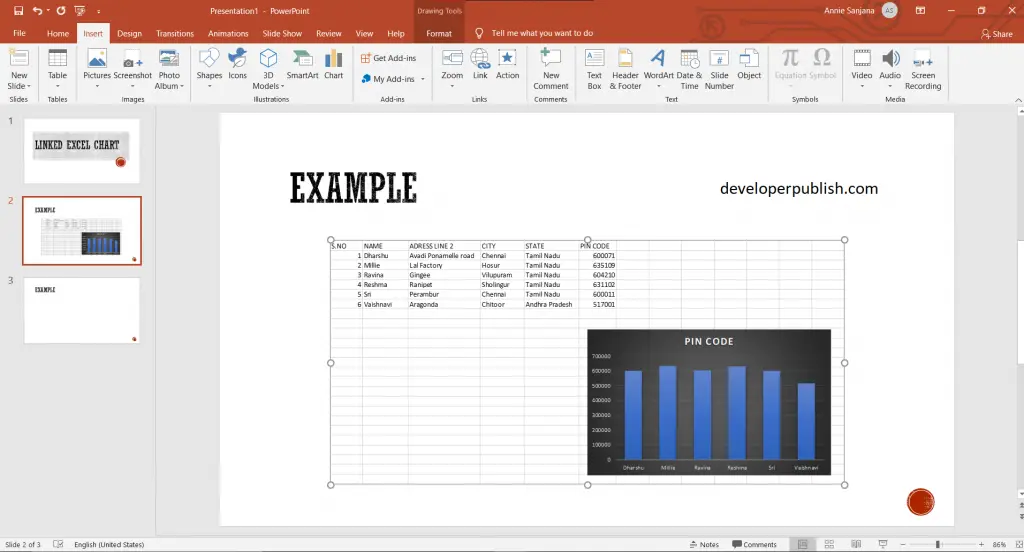
- When you click on OK, you can see the excel chart sheet in PowerPoint.
We hope that this article was helpful and understandable.