How to Create a Chart Sheet in Excel?
In this post, you’ll learn about Chart Sheet in Microsoft Excel and how to create a new chart sheet in excel.
Chart Sheet in Microsoft Excel is a worksheet that contains only Charts so that it provides a clear view of data in that chart.
How to Create a Chart Sheet in Excel?
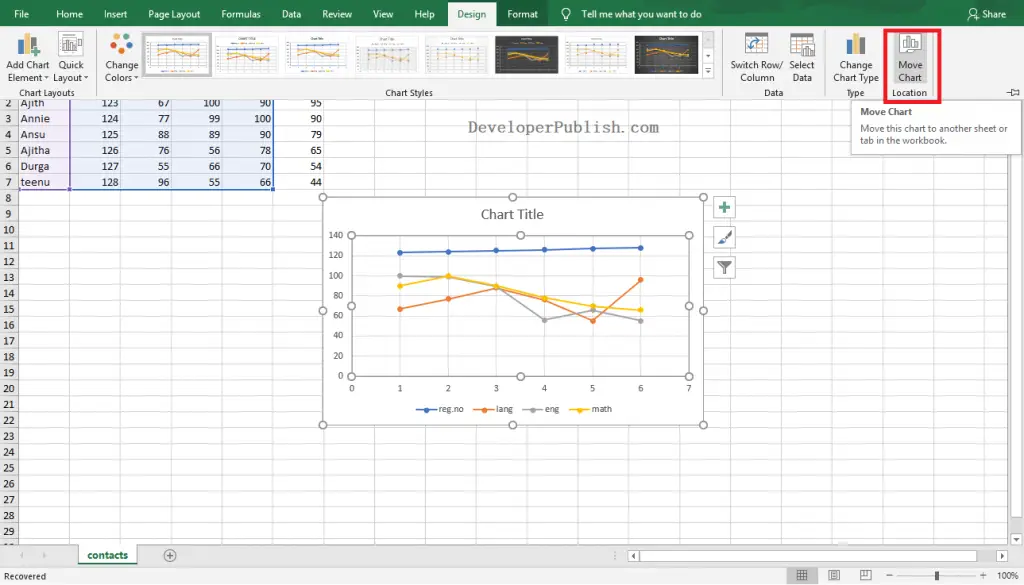
- To get started, select the chart that we want to view in your chart sheet.
- Now, go to Design Tab in the ribbon.
- Then, click on the Move Chart option in the Location group.
- The Move Chart dialog box will appear as shown in the below image.
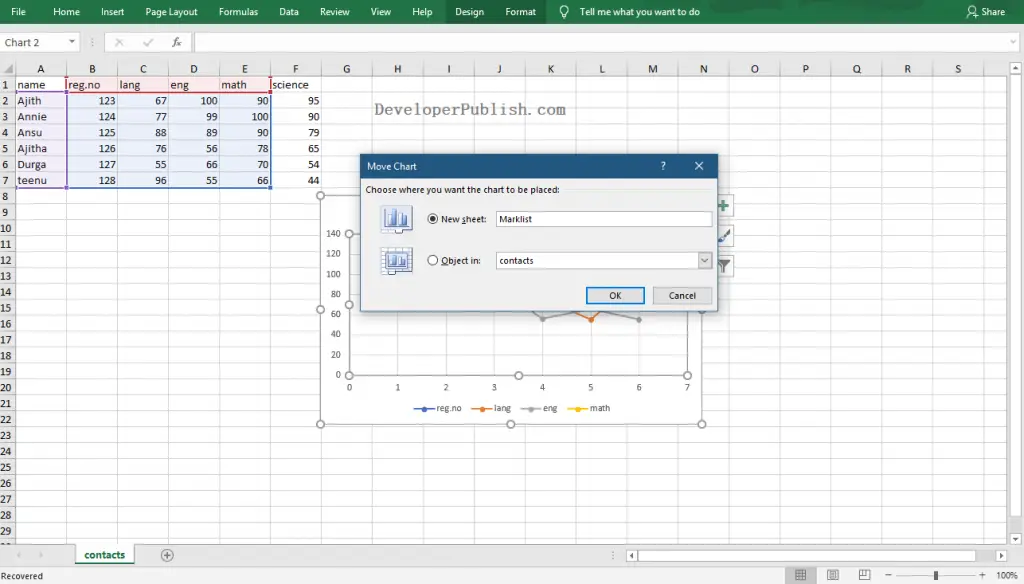
- Enter the name for the chart sheet and click the Ok button.
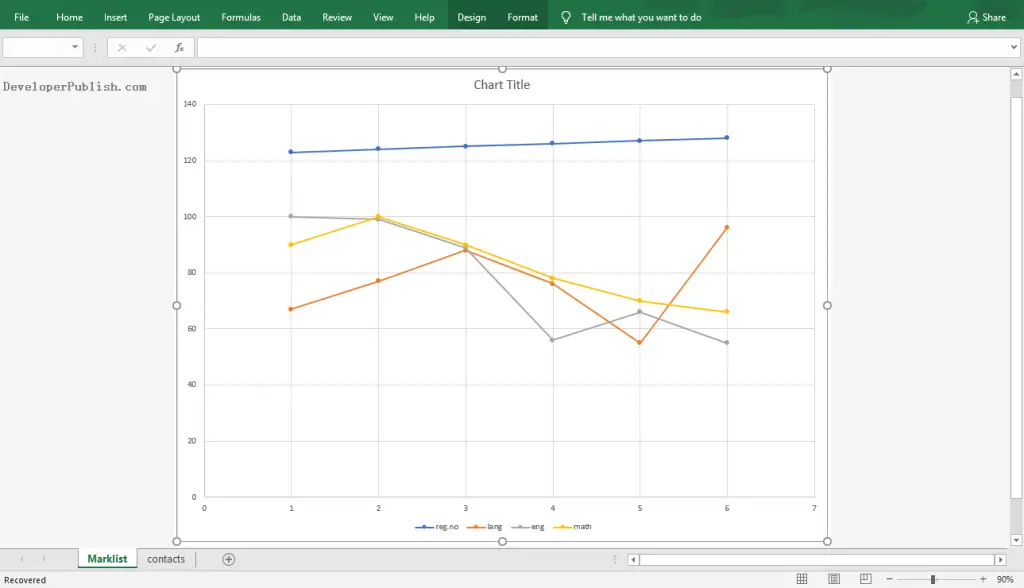
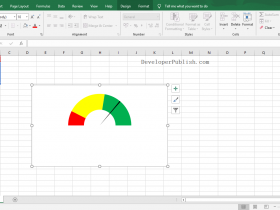
Now, we can view the created Chart Sheet on the worksheet as in the above image.


Leave a Review