In this post, you’ll get to know about the Bar Chart in Excel and how to create and use a Bar Chart in Microsoft Excel.
The Bar Chart is one of the chart types in Excel is also called a Bar Graph. Bar chart helps to display the distribution of data, also helps in comparing and tracing change over period.
How to Create a Bar Chart in Excel?
To create a Bar Chart in Excel, follow the below-mentioned steps:
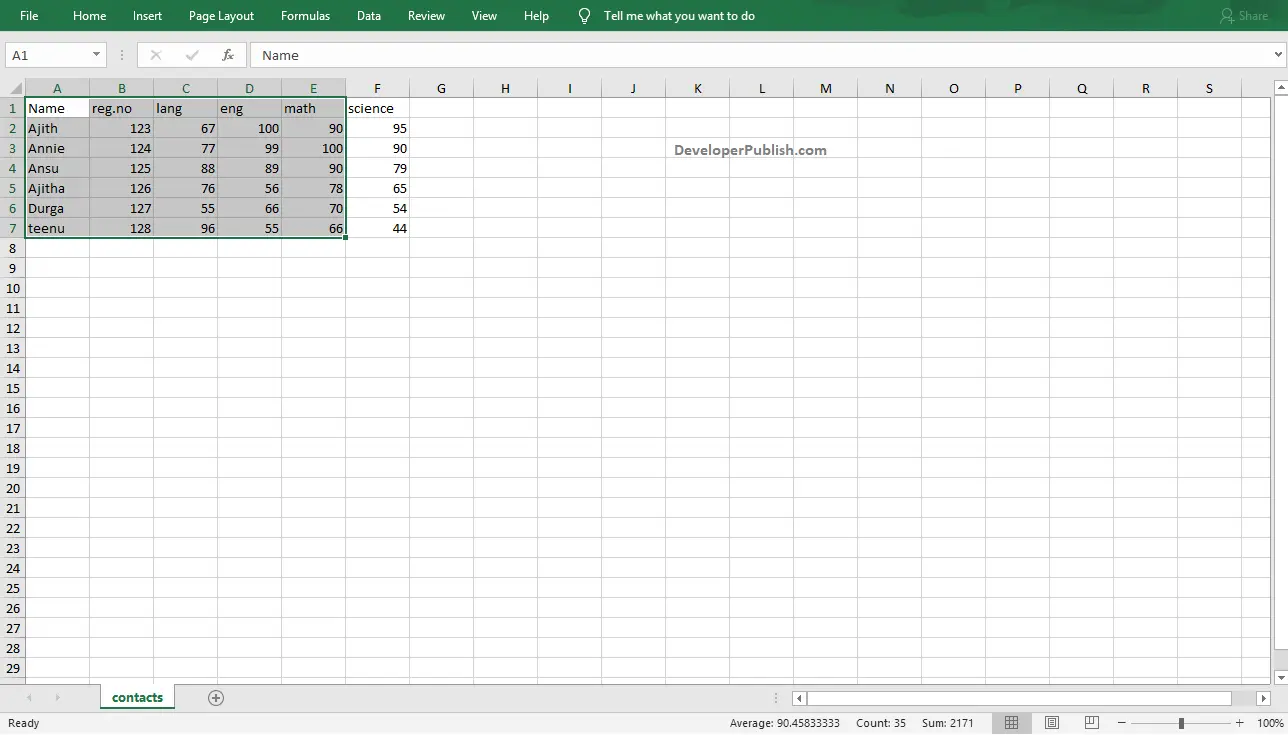
- To get started, select the range of data that you want to include in your chart.
- Go to the Insert Tab and click on the Insert Bar Chart button in the Charts group.
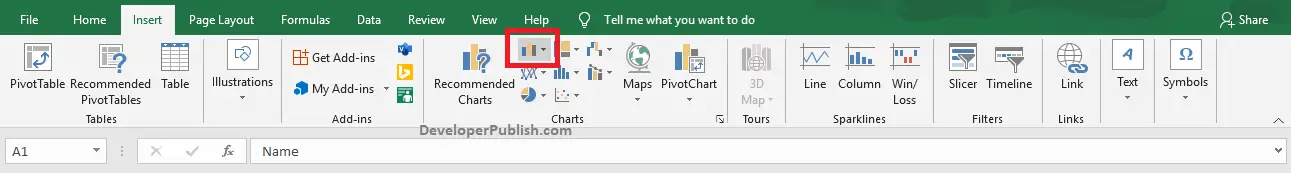
- Click on the down arrow in the Insert Bar Chart button to get different types of Bar charts.
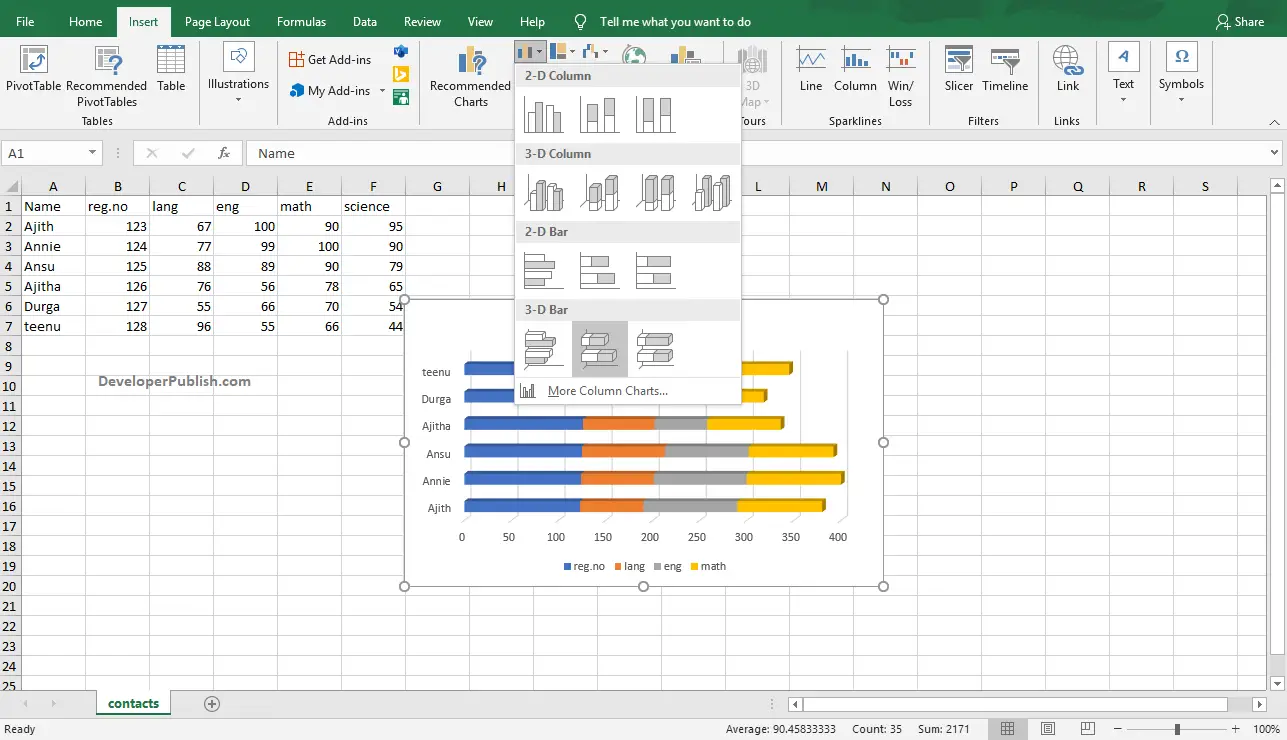
- Move the cursor through the icons and pause to get the preview of that type. Select the desired type of bar chart by clicking on it.
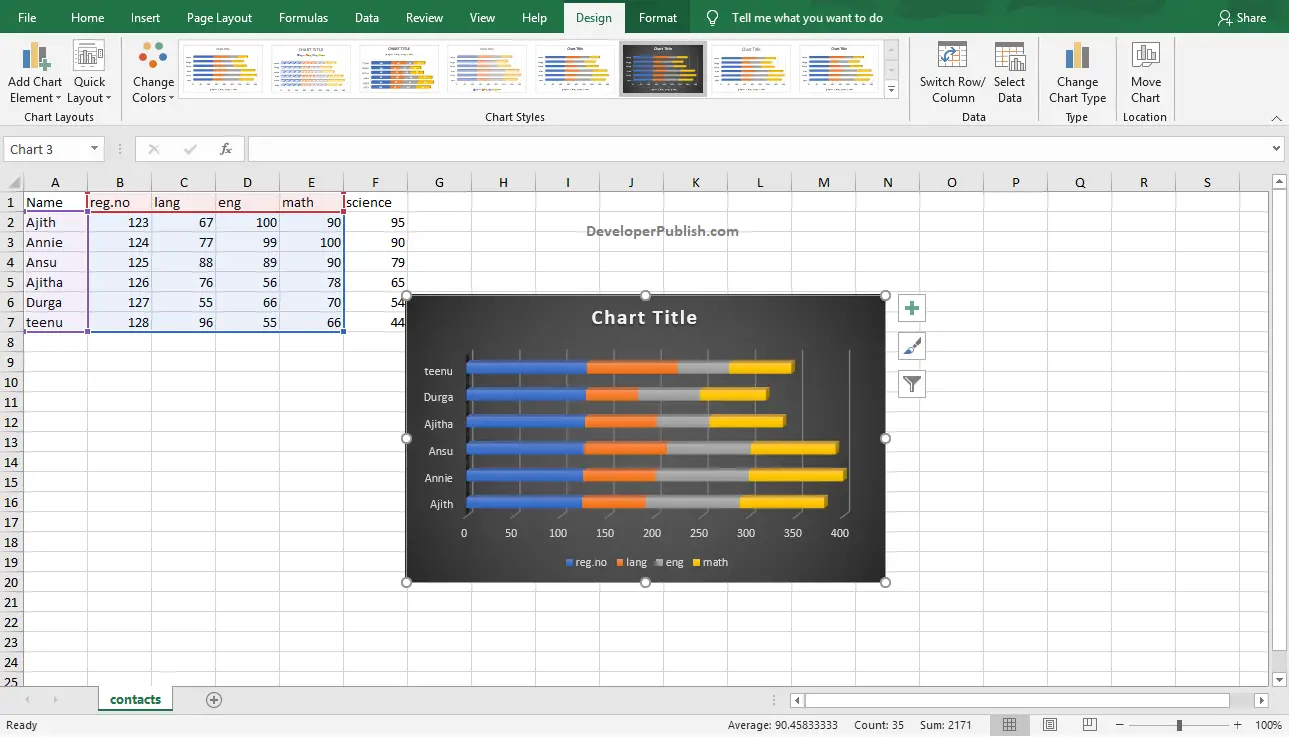
- The above image shows the created Bar chart on the worksheet in Microsoft Excel.
To change the style of the chart created, click on the chart and go to Design Tab and Select the desired bar chart style from the Chart Styles group by clicking on it.