In this post, you will learn about Sparklines with pivot tables in Excel and how to use them in your excel spreadsheet.
Sparklines with Pivot Tables in Excel
Sparklines are tiny little graphs (both lines and bars) that can be placed in a cell in Excel. When you have a large set of datasets, these sparklines can help you in showing the trend over the period.
It adds up quality to your report and gives you clear view of the values you looking at.
Sparklines has limited functionalities when compared to standard charts in the Excel.
Types of Sparklines in Excel
Sparklines are of three different types. You can use them based on your requirements. They are
- Line
- Column
- Win-loss (it is also termed as the binary sparkline due to its applications. It is used in the places of Yes or No, True or False, etc.
Here are a few important things to know about Excel Sparklines:
- Sparklines are updated automatically. They depend on the dataset directly, so a slight change in the values will alter the structure of the data lines.
- The size of the sparklines depends on the size of the cell that resides in.
- Similar to the charts, you can enter texts in the sparklines cells too.
- The styles of the sparklines such as its colors, data point, axis can be altered
How to Insert Sparklines in Excel?
Let’s see how to insert sparklines in a cell in Excel.’
Take a look at example below.
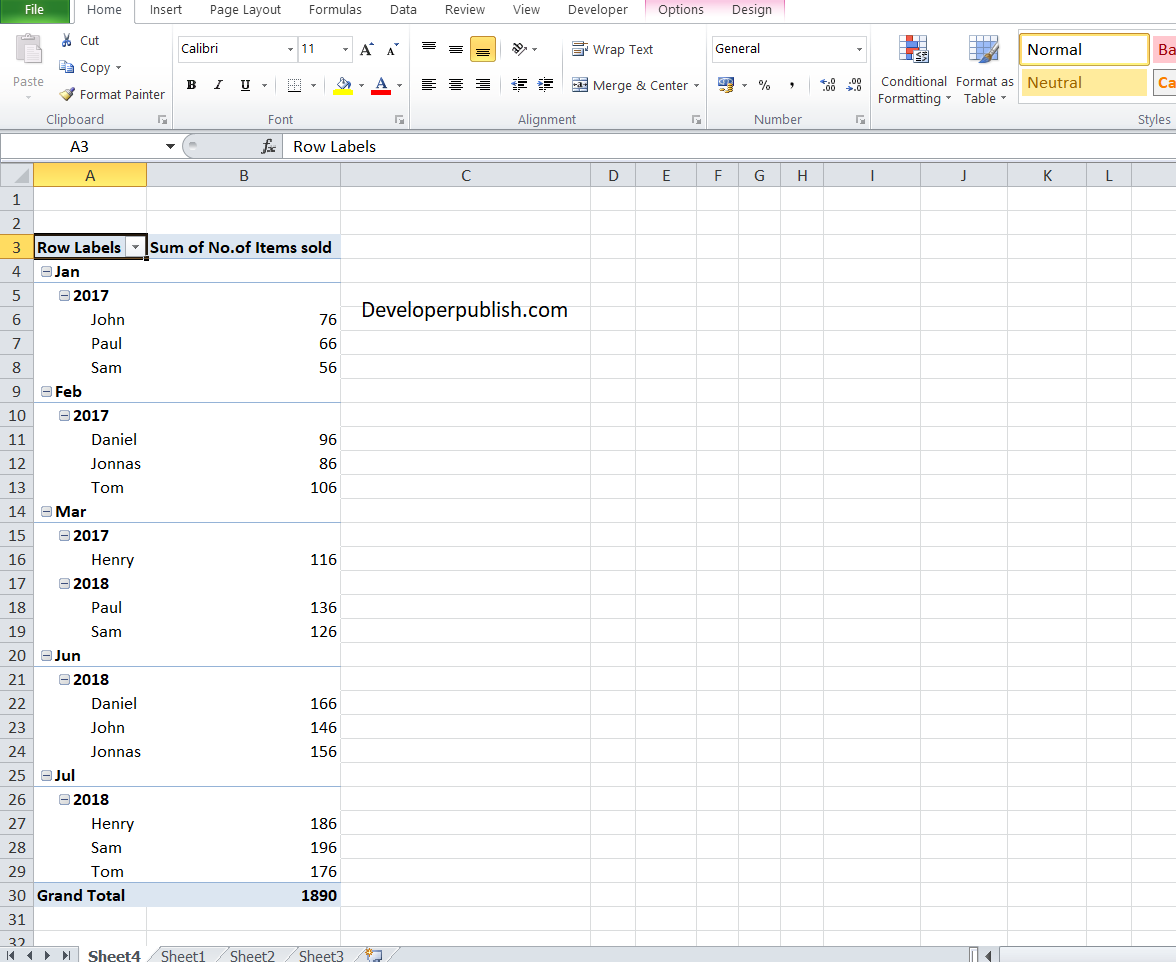
- Click on the cell where you wanted to insert the sparkline. Or you can choose the blank cell next to the values in the Pivot table.
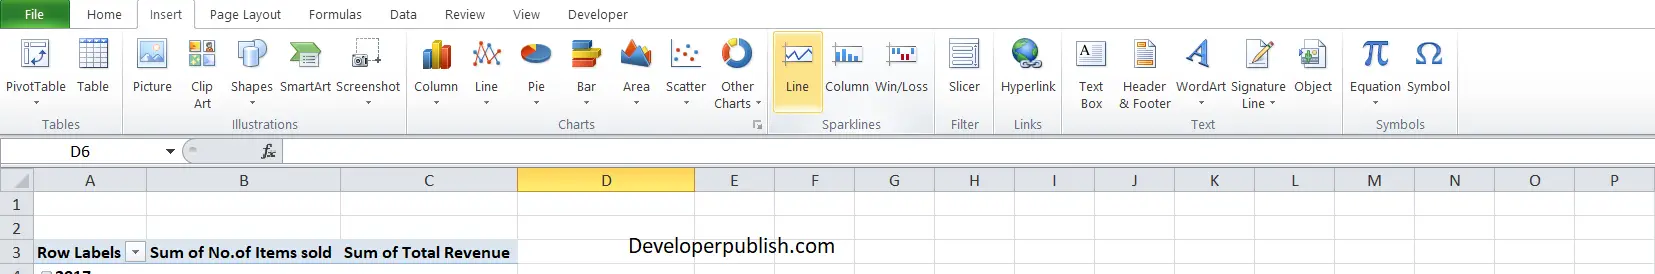
- Click on the Insert tab from the ribbon.
- From the Sparklines group click on the required sparkline option.
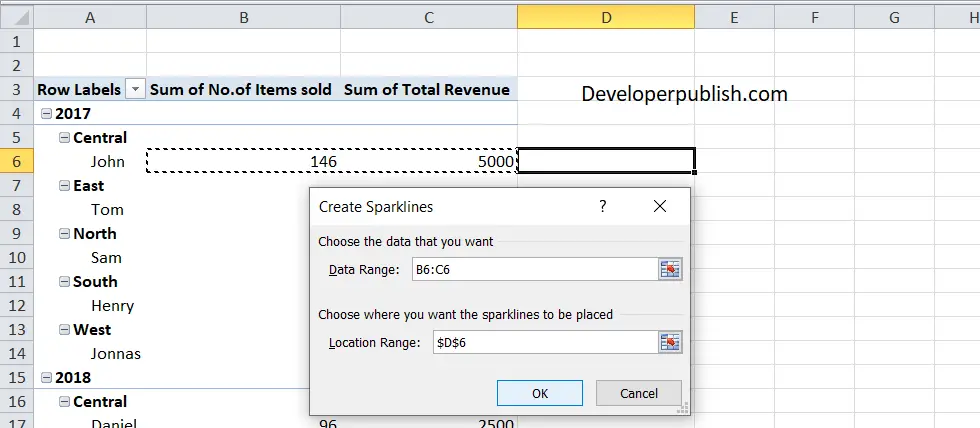
- The ‘Create Sparklines’ dialog box opens, where you can select the data range for the sparkline.
- Now, Click OK.
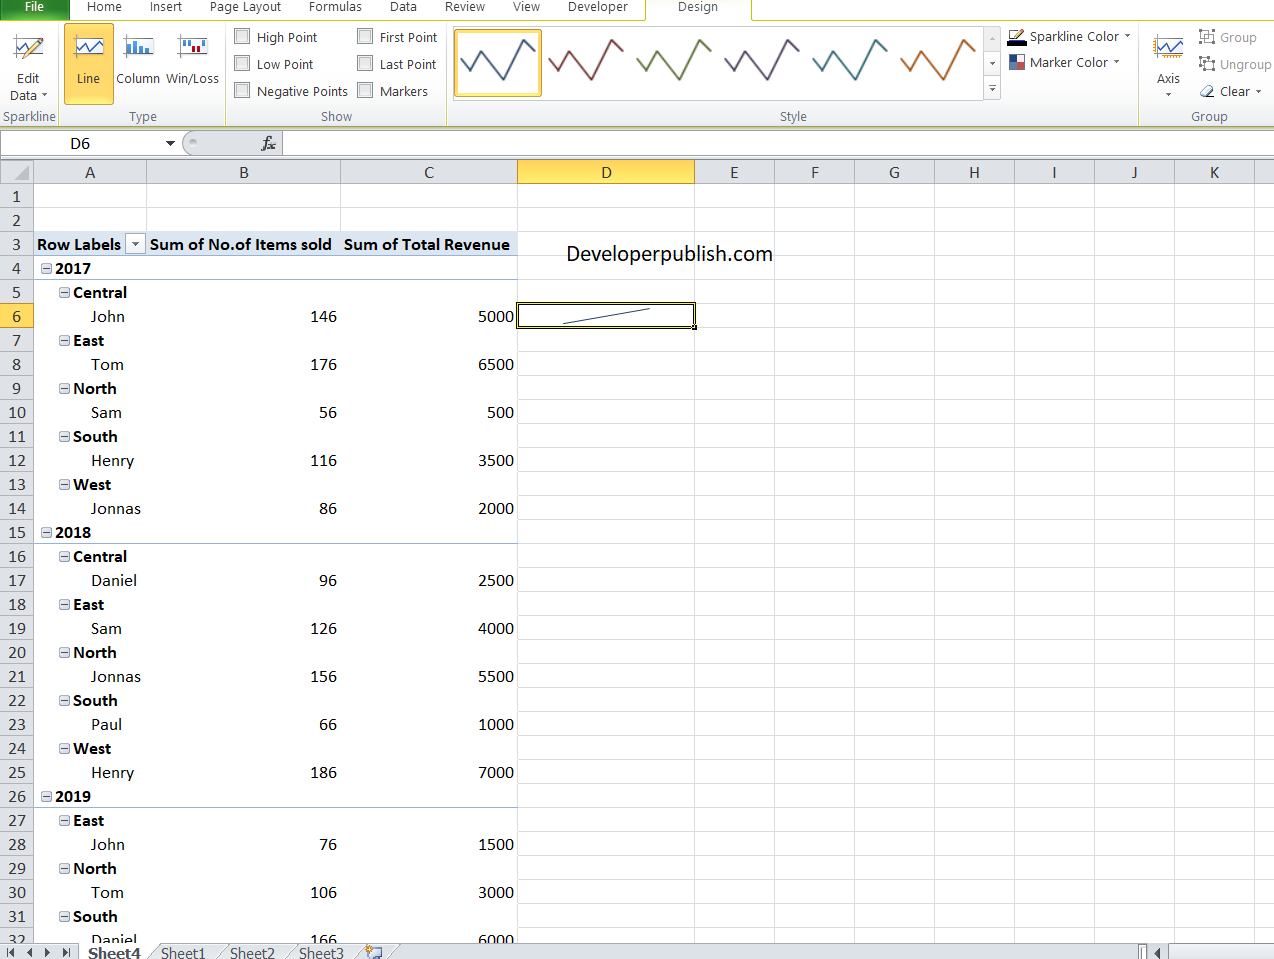
- The sparkline is inserted in the chosen cell.
Be it any type of sparkline, the procedure to insert them is the same as the above.
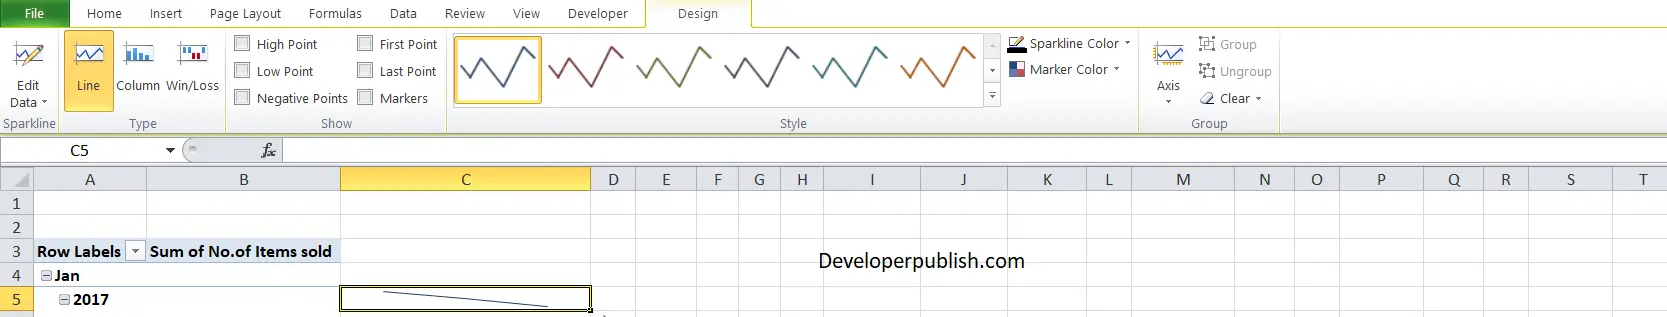
As we discussed earlier, we can change the styles of the sparklines.
So to change the styles of the sparklines:
- Click on the cell that has a Sparkline.
- Under the Sparkline Tools Design tab, you can change the styles of the lines from the options.
How to Edit the Dataset of Existing Sparklines?
Using the Edit Data option, you can change the data of an existing sparkline.
The edit data option has the following sub-options.
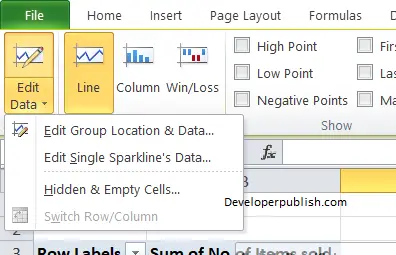
Edit Group Location & Data: It is used to change the data for the entire group of multiple sparklines.
Edit Single Sparkline’s Data: It is used to change the data for a particular sparkline.
Hidden and Empty cells: Let’s see the how to use this
Handling Hidden and Empty Cells
It is always possible to have an empty cell in large data set and in times like this, the sparklines are dissected at the point of empty cells.
But you can command the sparklines on how you want these empty cells to be treated.
To handle hidden and Empty cells:
- Click the cell that has the sparkline with the empty cell.
- From the Design tab, click on the Edit Data option
- From the drop-down, select the third option, the ‘Hidden & Empty Cells’ option.
- A new dialog box that opens, choose the required option
Changing the Sparkline Type
If you want to quickly change the sparkline type – from line to column or vice versa, you can do that using the following steps:
- Click the sparkline you want to change.
- Click the Sparkline Tools Design tab.
- In the Type group, select the sparkline you want.
How to highlight Data Points in Sparklines?
You can highlight the maximum and the minimum data points, first and the last data point, as well as all the negative data points.
To do this,
- Click on the sparkline cell and go to the Design tab in the ribbon.
- In the show group, you can choose the required points that you wish to mark in the sparklines.
Sparklines Color and Style
In the same tab, you can change the style and color of the sparkline in the style and color options.
Adding an Axis
To add an axis to the Sparkline, follow these steps.
Here is how to do this:
- Choose the cell with the sparkline(s).
- Click on the Sparkline Tools Design tab.
- Click on the Axis option.
- From the drop-down, click on the Custom Value.
- Now, in the Sparkline Vertical Axis Settings dialog box, enter the value as 0 which would be the minimum value of the axis.
- Click OK.
Note: If your data set has negative values, then it is advised not to keep an axis.
Group & Ungroup Sparklines
When you have multiple sparklines in your report, it is better to group them together. This will be helpful when we need multiple changes and you need to change each sparkline, but when grouped, it all changes at the same time.
To group Sparklines:
- Select the ones that you want to group.
- Click on the Sparklines Tools Design tab.
- Click the Group icon.
To ungroup, you can use the Ungroup option.
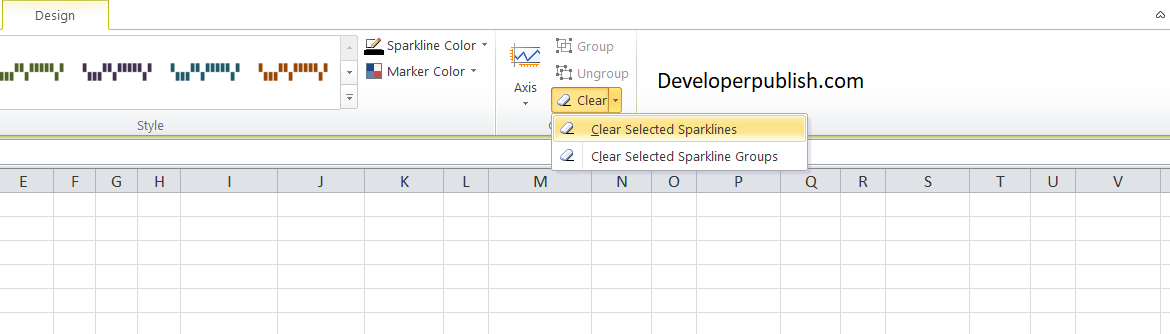
Deleting the Sparklines
Normally to delete the contents of the cell, we will select the cell and we will hit the delete button which deletes the contents of the cells, but this cannot be applied to sparklines.
To delete a sparkline, follow the steps below:
- Click on the cell that has the sparkline that you want to delete.
- On the Design tab, click on the Sparkline Tools group.
- Click the Clear option.