In this post, you’ll will learn about Sparklines in Microsoft Excel and how to add spark lines to the data series in an excel spreadsheet.
What are Sparklines in Excel?
The Sparklines represent the tiny chart of the data. It helps to know the trends of that data series easily because of their compact size. It helps to visualize the data quickly. There are three types of Sparklines called Line Sparklines, Column Sparklines, and Win/Loss Sparklines.
How to Add Sparklines in Excel?
To add sparklines in your Excel worksheet, do the below-mentioned steps:
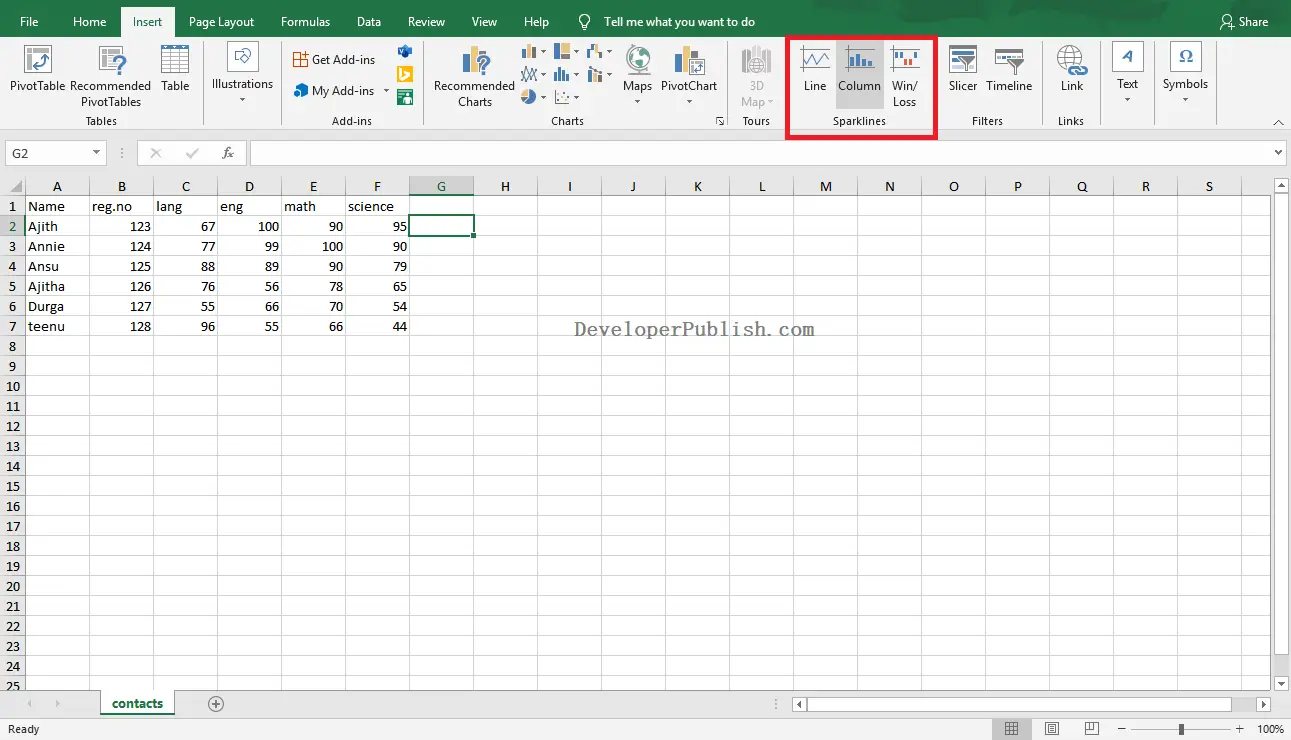
- To get started, select the row you want to add the sparklines in the worksheet.
- Go to Insert Tab and select the desired type of sparkline from the Sparklines group.
- The Create Sparklines dialog box will appear on your screen as in the below image.
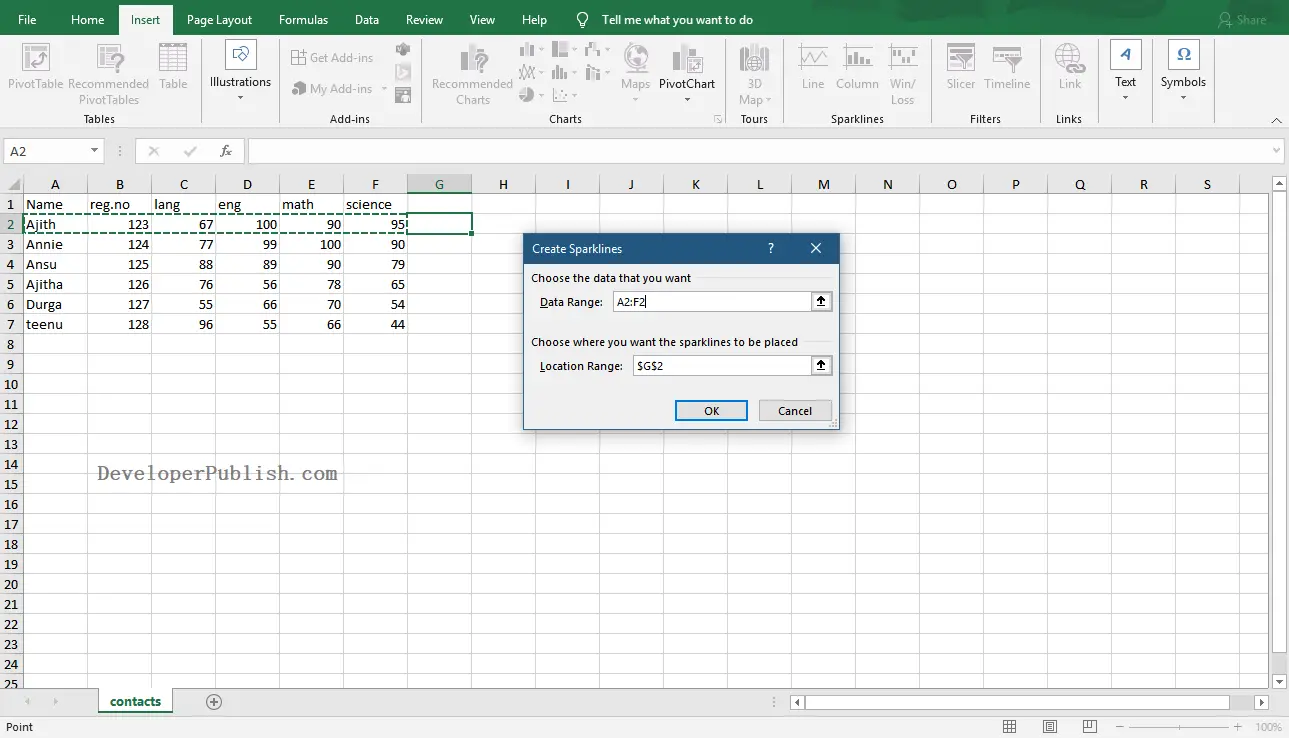
- You can enter the range of the data series to add sparklines in the Data Range text box. You also can directly drag the handles to select the data.
- Click the Ok button to add the sparklines.
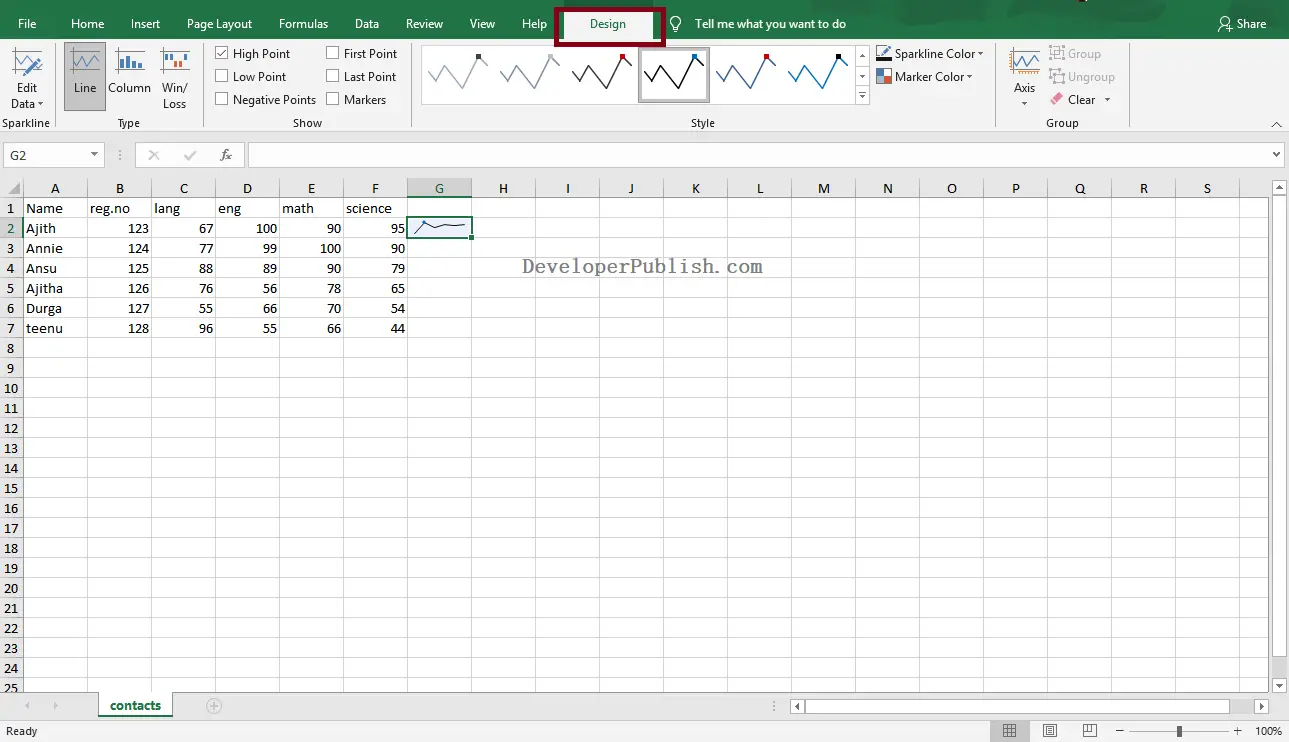
To get more options to format the sparklines and change the type of sparkline, go to Design Tab and pick the desired option.