In this post, let’s have a look at some of the top 20 tools that can be used for creating infographics from scratch.
What is an infographic?
By definition, an infographic is a way of representing a given data through a collection of imagery, charts, and minimal text that gives an easy-to-understand overview of a topic. Infographics are visual representation of any kind of information or data.
Infographic can be of anything, it may be a study on share market or a step-by-step guide on how to cook, an infographic can help you present that information in the form of an attractive visual graphic.
Use of Infographics
Infographics can improve cognition by utilizing graphics to enhance the human visual system’s ability to see patterns and trends. Infographics display large amounts of data and information in the form of a graph or picture or candle stick diagrams. They’re entertaining, eye-catching, concise, and most of the information they contain is easily understandable by the reader.
Using infographics is also a quick way of getting your point to your customer and grabbing their attention, and make it easier for the image to go viral. Nowadays, infographics is a new way of attracting the niche customers to your business.
With the increase in the uses of infographics, let’s learn about some of the tools where we can develop infographics from scratch.
No prior order, a random order of useful tools.
Top 20 tools for creating Infographics from scratch
1.Cacoo
It is pretty much useful create some cute colored mind-maps that can double up as infographics as well. Added to it, you can make flowcharts, presentations and even, wireframes and sitemaps. The free plan allows you to create 25 sheets and you can export it only as PNG, which is a drawback.
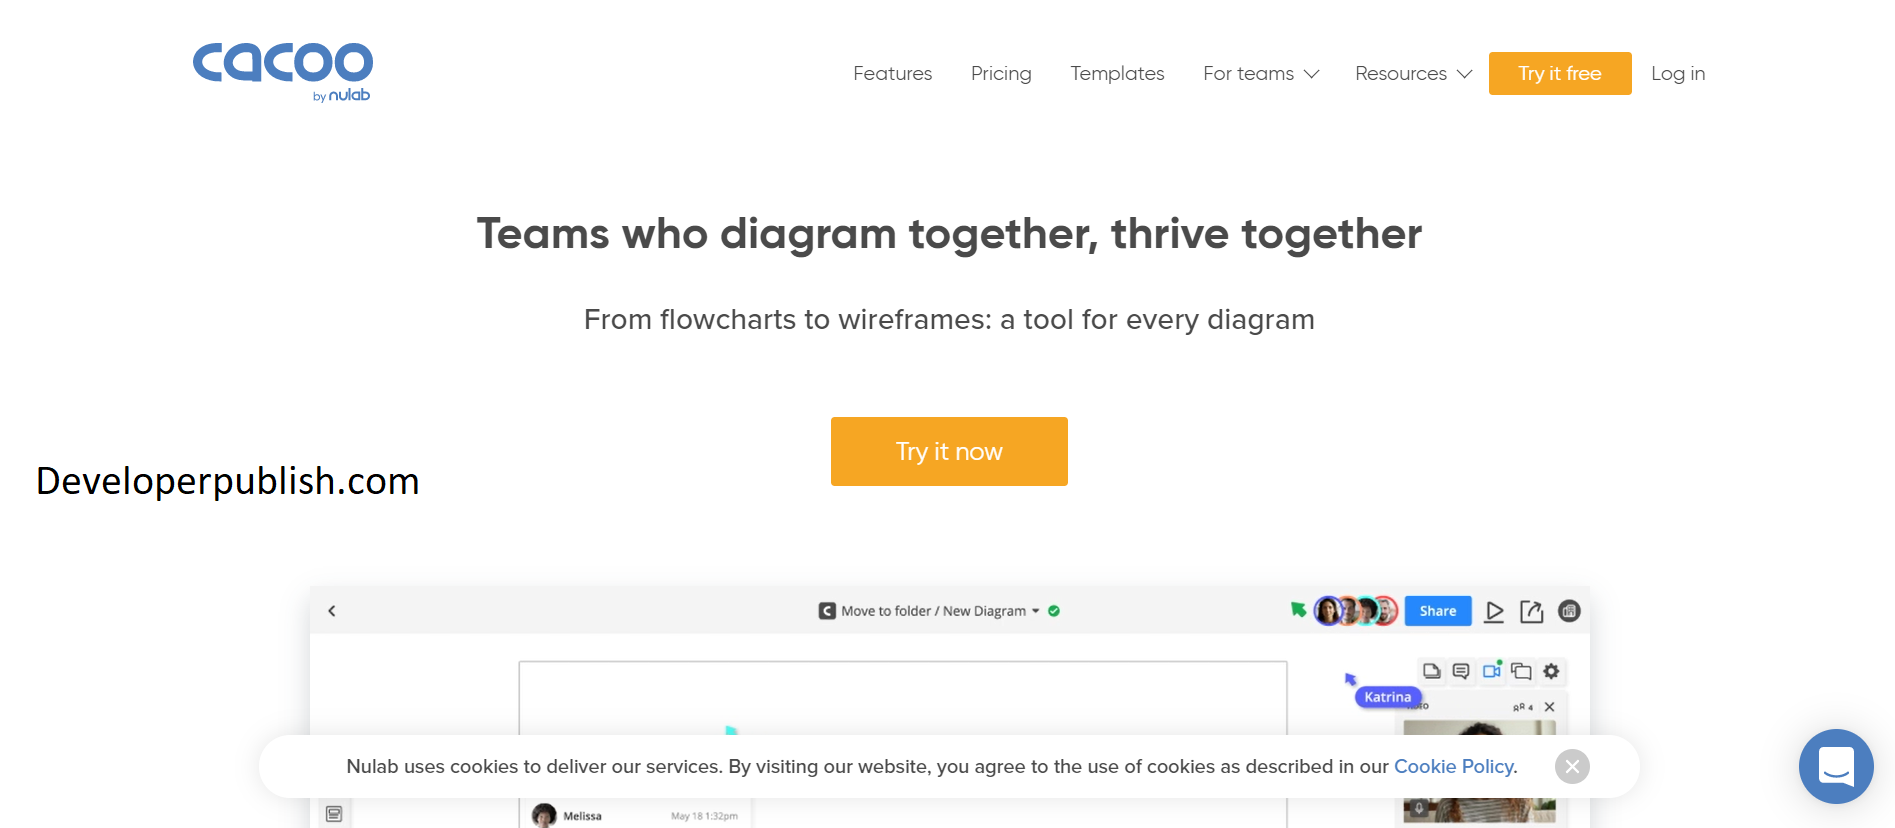
You can check it here : https://cacoo.com/
2.Canva
Make data beautiful—and easy to digest. With Canva’s free infographics maker, there’s no need to struggle with complicated design software. Simply choose an infographic template, add your information and there you have it: A stunning custom infographic.
Canva has an extensive range of templates and thousands of illustrations—meaning whatever your subject matter, you can bring it to life with our free and easy infographic creator.
It has both free and premium accounts, trust me the free one is way more than many of other tool’s premium accounts. It’s UI &UX is subtle, which makes it easy for its users.
To create infographics in Canva, all you need to do is choose the Infographics option from the Create a Design menu. It gives you a bunch of ready-to-use free layouts that you can easily customize with your data, other icons and more. My go to choice is always canva.
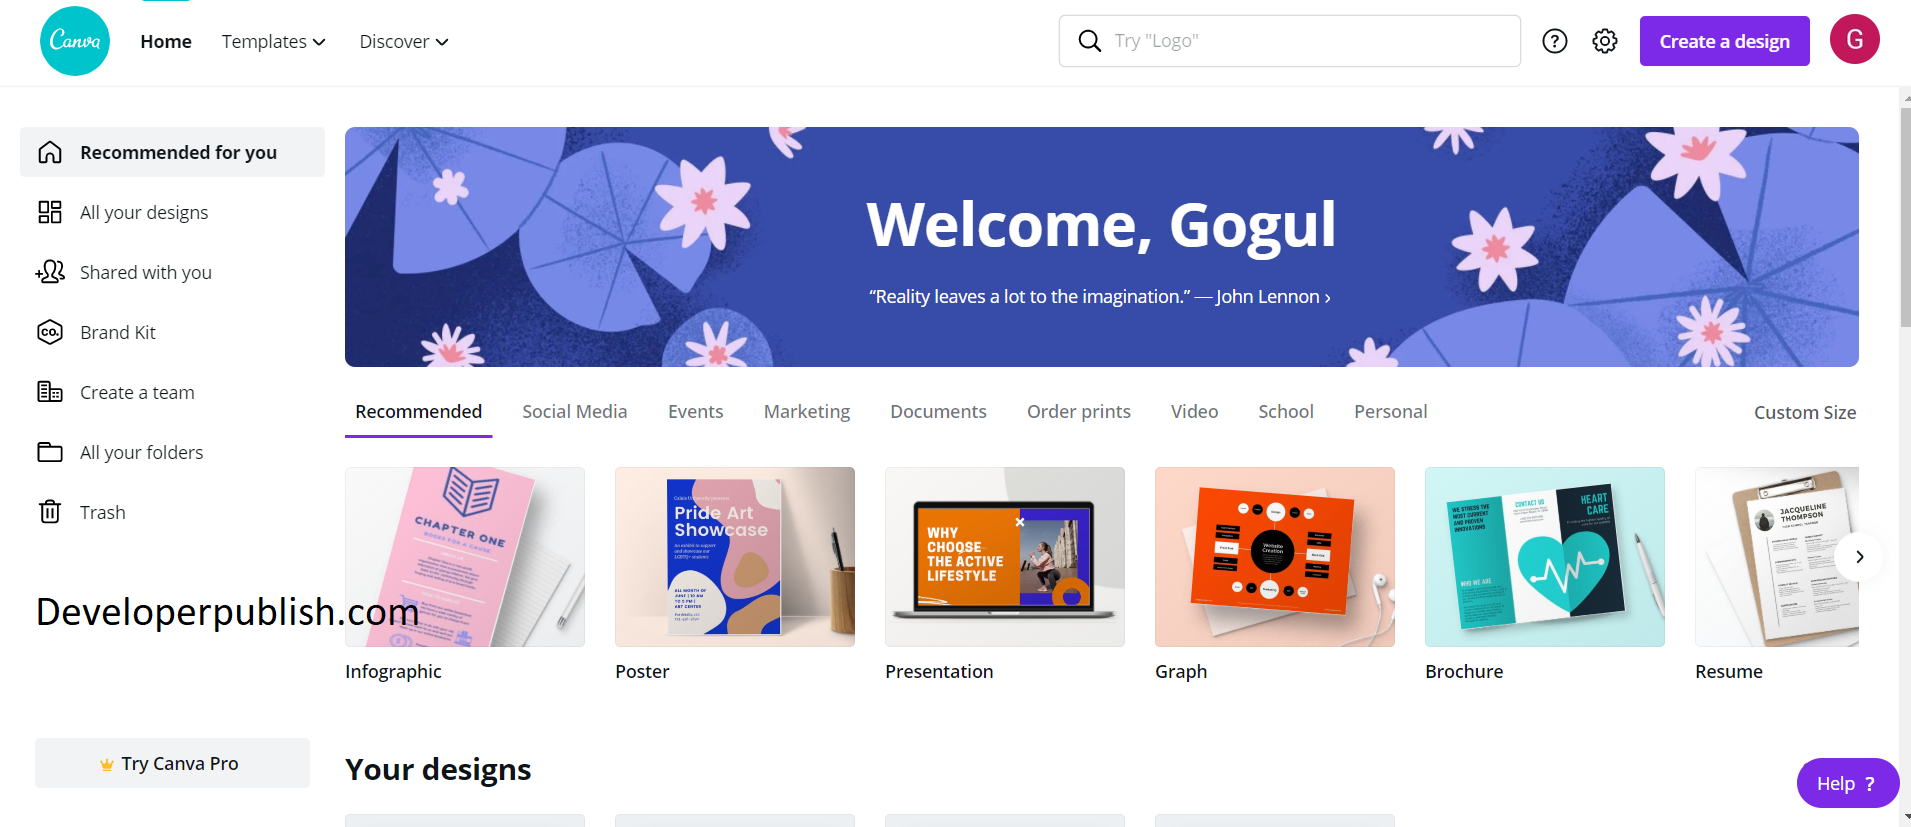
Check it here: https://www.canva.com/
3.Creately
Creately is a flowchart and digramatic tool. The free account does gives you access to only 5 free infographic content. If you are just a trial user, then this is best suited one for you.
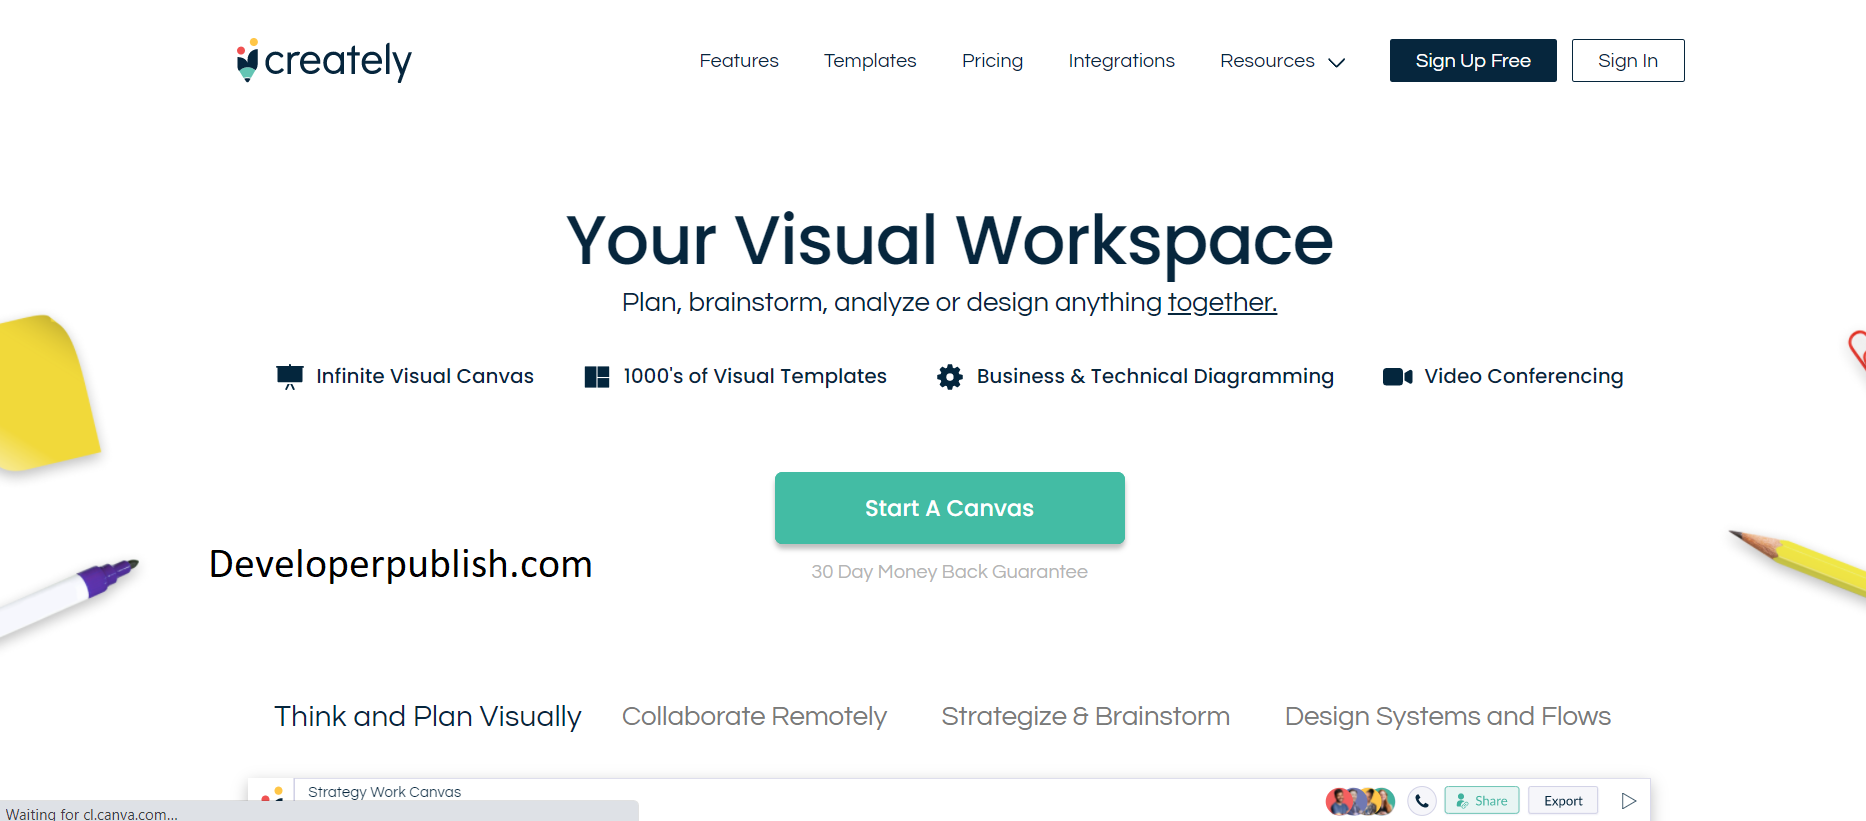
Check it here: https://creately.com/
4.Datavisu.al
Datavisu.al is a web-based data visualization tool that lets you take boring numbers and turn them into visual graphs. Like others, they have pre-designed templates and you also have the option to design your own. Once your chart is designed and you’ve inputted your data, you can export the file as a PNG, embeddable code or a PDF.
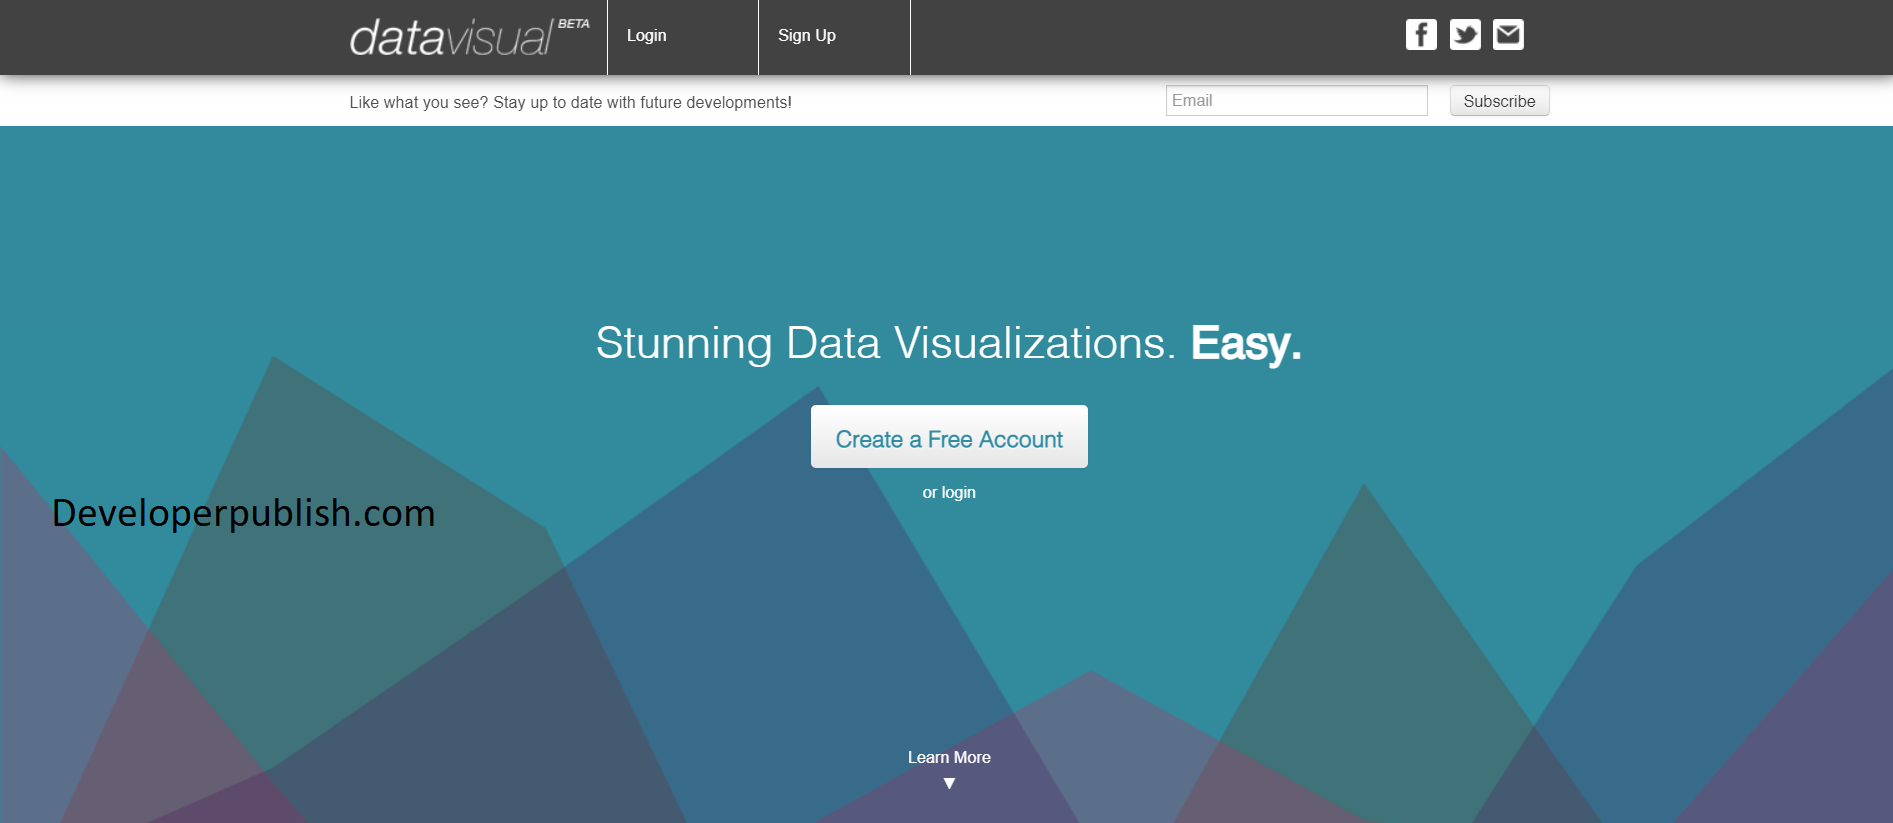
Check it here : https://datavisu.al/
5. Visme
Design and share beautiful on-brand presentations, infographics and any other visual communications for you and your team. Visme is everything you need to create beautiful content. It’s one tool to design, store and share your content. One tool that gives you all the templates, graphics, assets you need.
Check it here: https://www.visme.co/
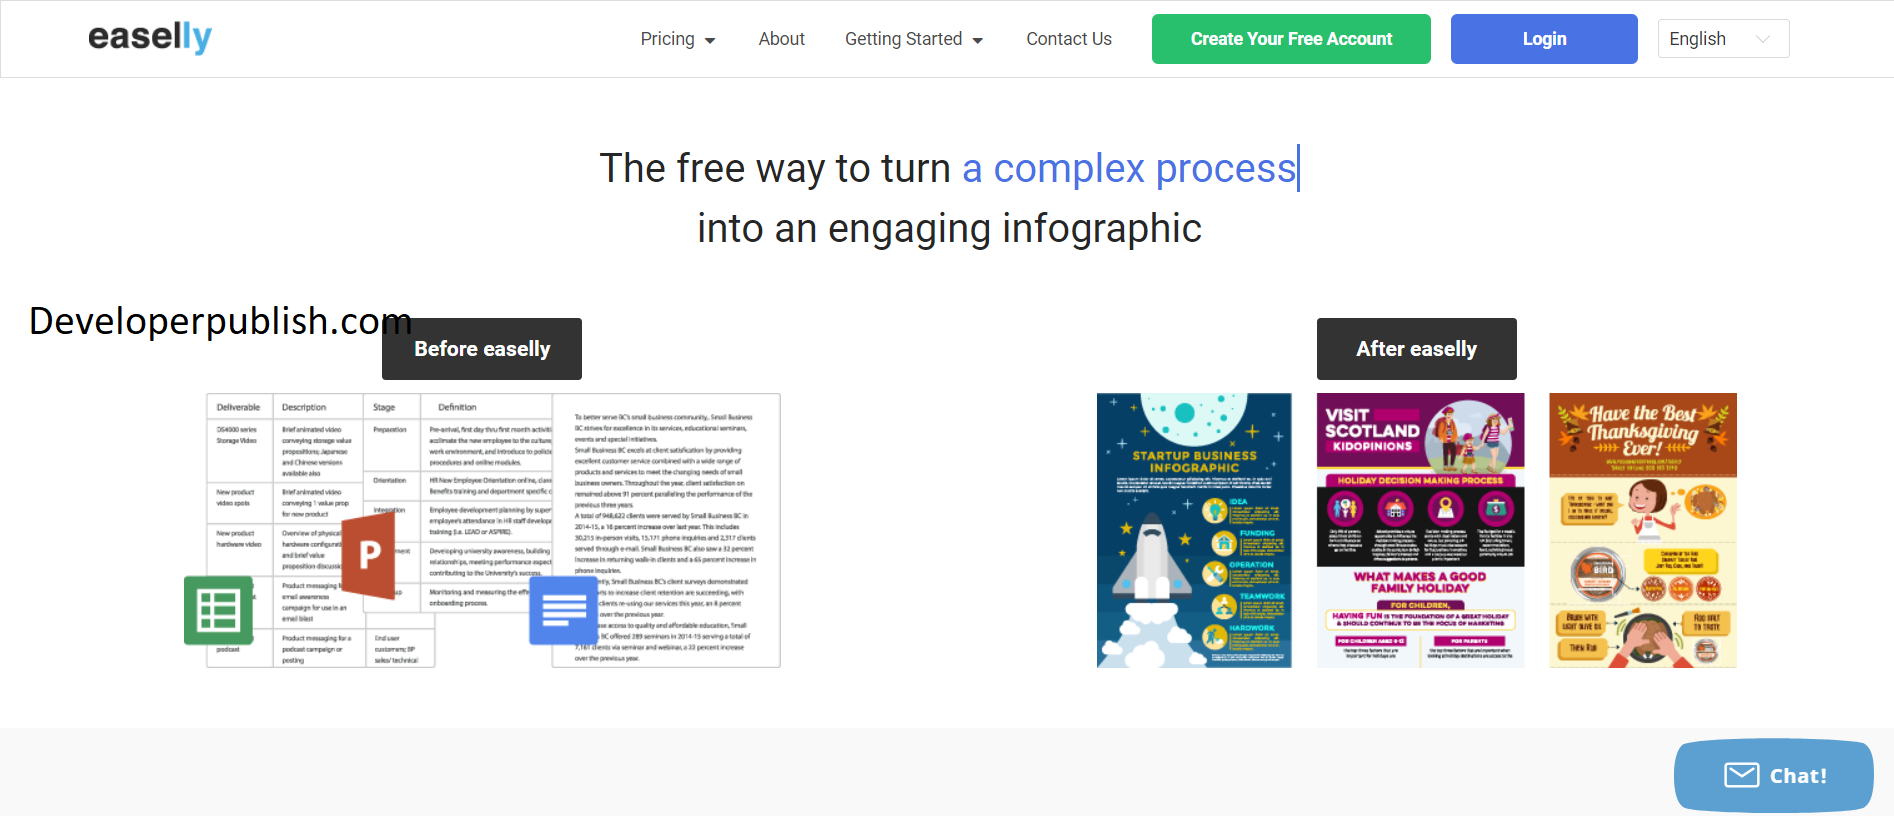
6.Easel.ly
Yet another infographic tool, with a lot of pre-loaded templates that you can easily tweak, edit and make magic with. You can customize your templates even without signing in. It supports with loads of options of backgrounds, drawing, fonts and even, illustration-style images.
Check it here: https://www.easel.ly/
7.Gliffy
It’s not an infographic tool, as a flowchart and diagramming tool, you can use Gliffy to build eye-catching diagrams. It’s great if you want to represent, sales funnels or even, strategy in a visual format.

Check it here: https://www.gliffy.com/
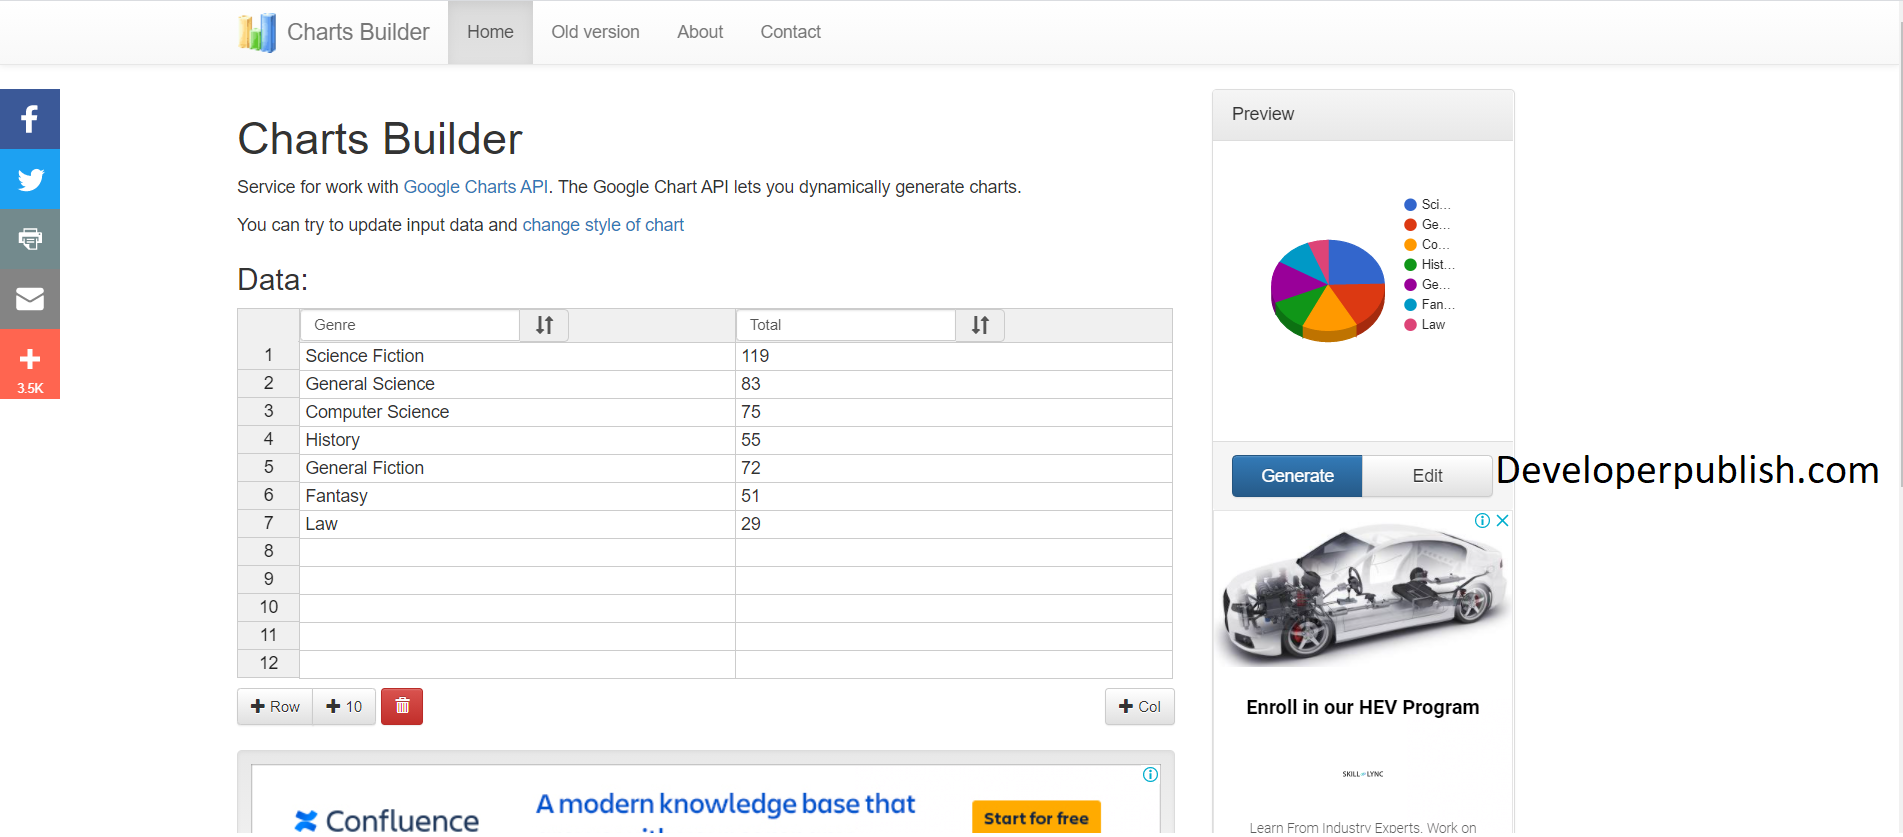
8.Hohli Charts
This cool tool uses the Google Charts API and turns data entry into colourful charts. It is super simple to use and you get a variety of options to change the style of the chart as well as choose to save it in different sizes.
Check it here: https://charts.hohli.com/
9.Hubspot
Hubspot is full of free templates you can use to create your own infographics, with ease. It is also used as templates for powepoint presentations and other business representation as well.

Check it here: https://www.hubspot.com/
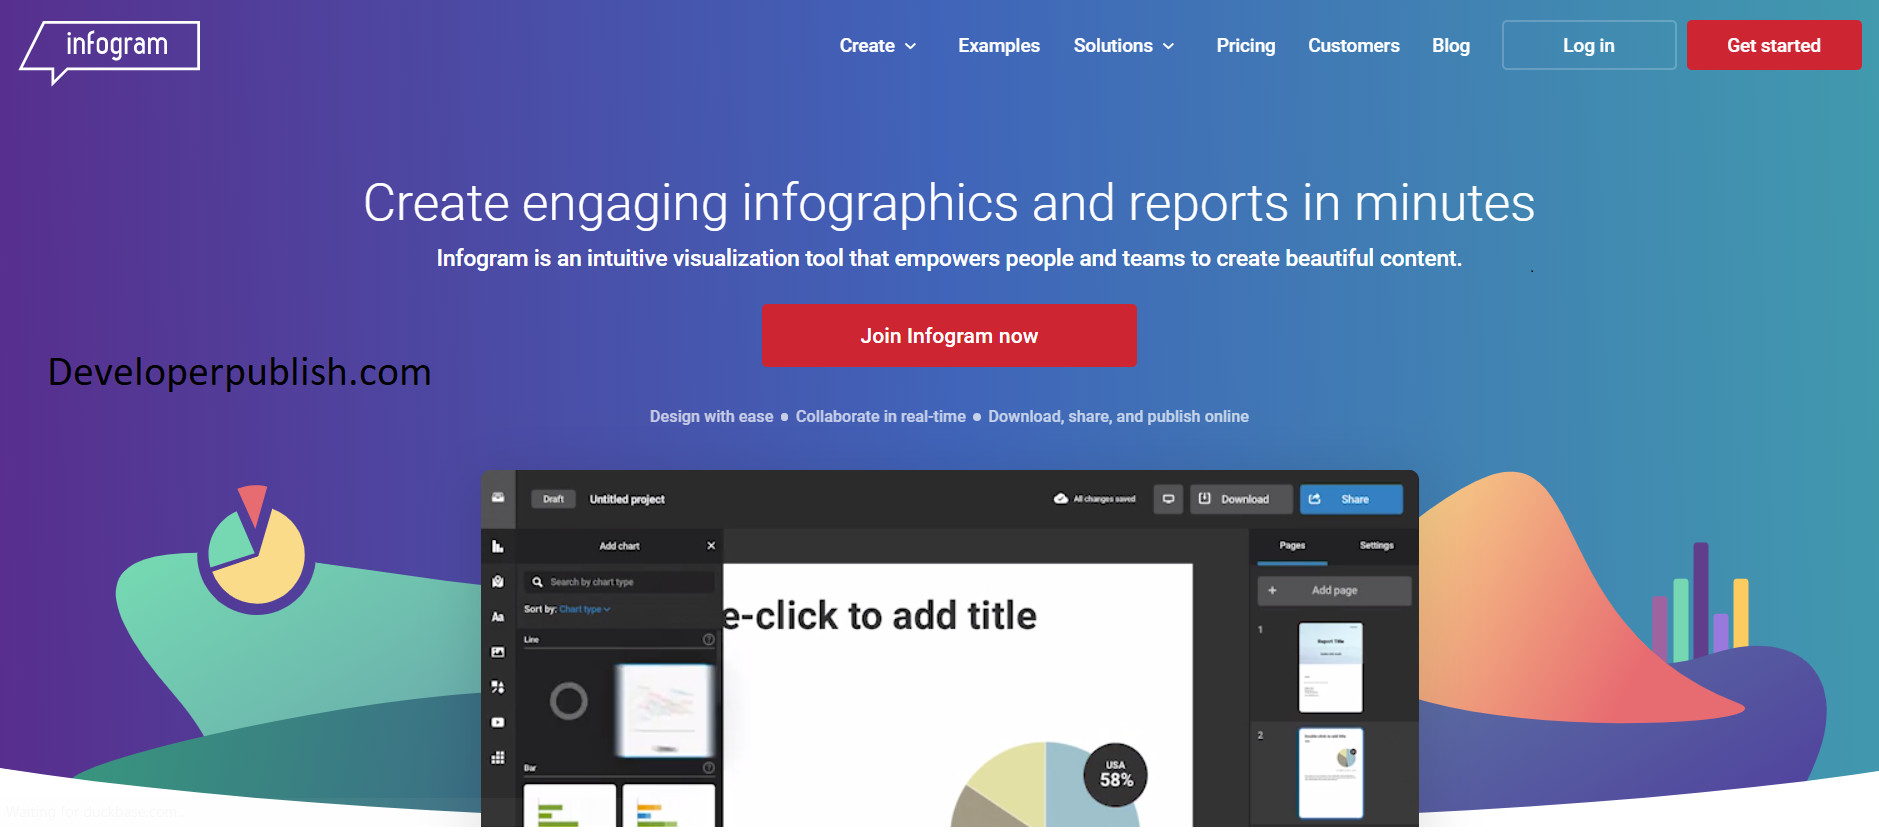
10.Infogr.am
Free, intuitive and easy-to-use Infogr.am is a one stop solution for all your infographic needs. You can create eye-catching charts, visually appealing brand stories and more. Unlike others, this site has a limitation that it allow you to do 10 infographic content for free and beyond that you need to have a paid account. It supports both monthly and yearly plans.
Check it here : https://infogram.com/
11.Picmonkey
Picmonkey is used to create infographics but, there are no pre-built themes or templates to help you do that. You can start by creating a collage and then, editing it to add text and overlays. In either case, you can use Picmonkey to create infographics and the free account gives you great options to initiate with!
Check it here: https://www.picmonkey.com/
12.Piktochart
Piktochart, an another infographic tool to bulid from scratch. Piktochart is so simple that you can immediately use it, without training. It’s super easy to use, loads of fun and you can use a free account to weave a ton of magic.
Check it here: https://piktochart.com/
13. Venngage
In Venngage you can absolutely get a forever free account (student version) and still create some of the best infographics ever. Also, like PicMonkey and Canva, this tool help you create tons of visual content with the click of a mouse.
Check it here: https://venngage.com/
14.StatPlanet
StatPlanet is not a web-based application but a software that you need to download to work on. It helps you create interactive maps in less amount of time. You can also use the software to create cool graphs and charts for “feature-rich infographics”.
Check it here: https://www.statsilk.com/software/statplanet
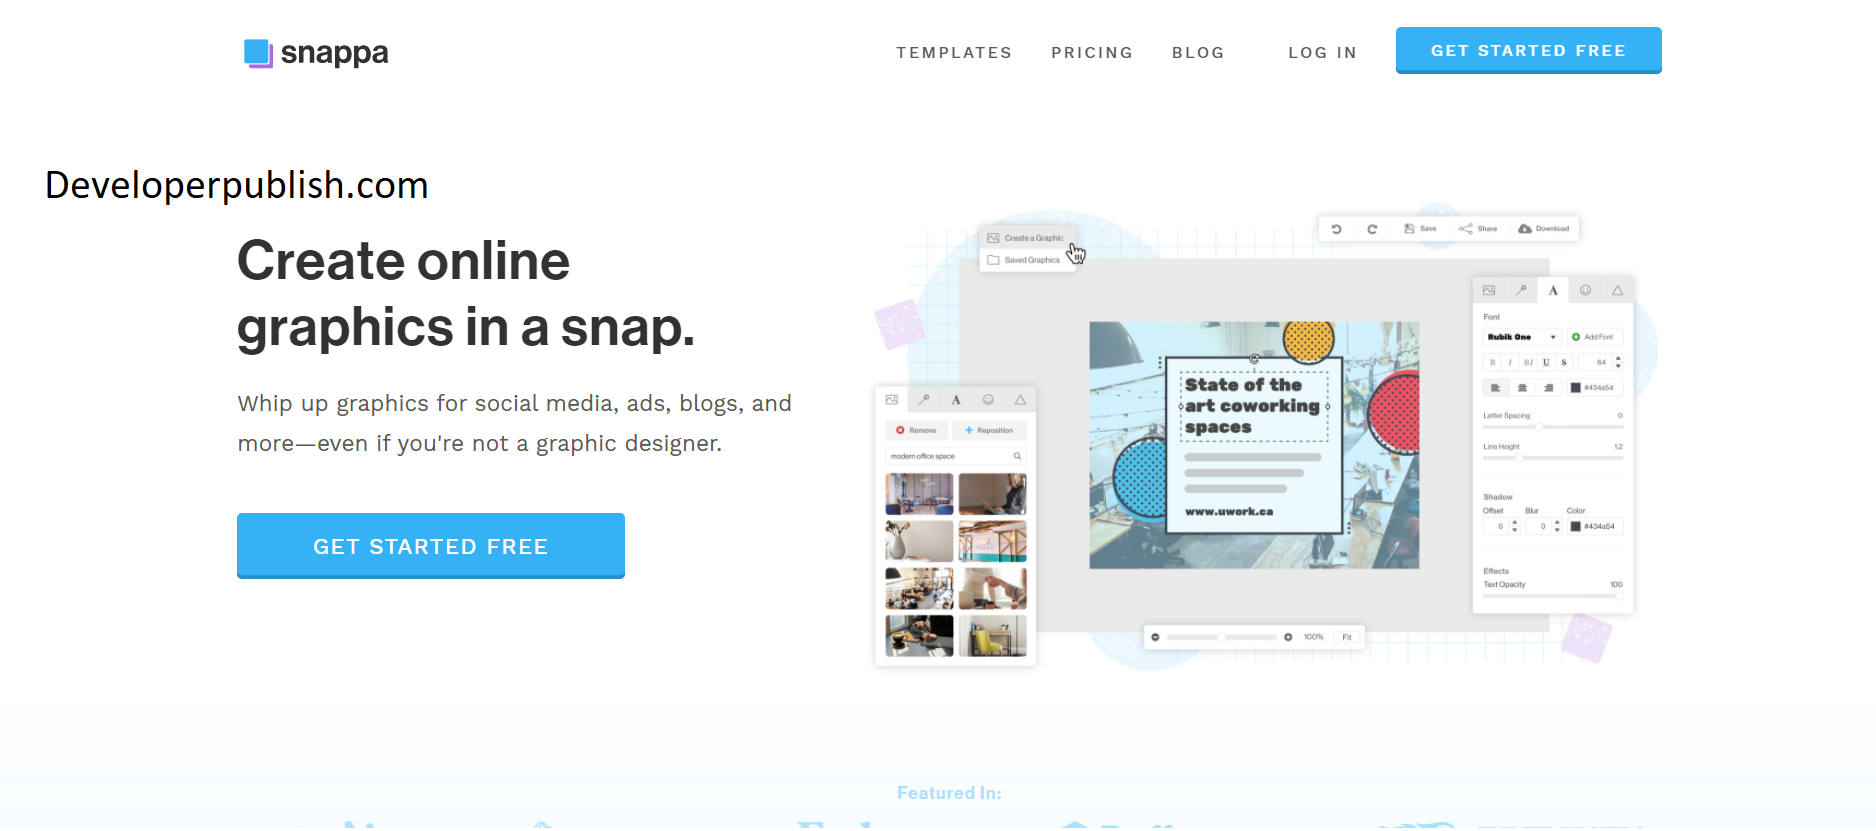
15.Snappa
Snappa is a versatile little design tool that was a pleasant discovery for me. Most design tools offer bare bones functionality for their free accounts. Not Snappa. You get nearly all the features of paid accounts with the free plan, with the only exception being limited downloads per month for free users.
Check it here: https://snappa.com/
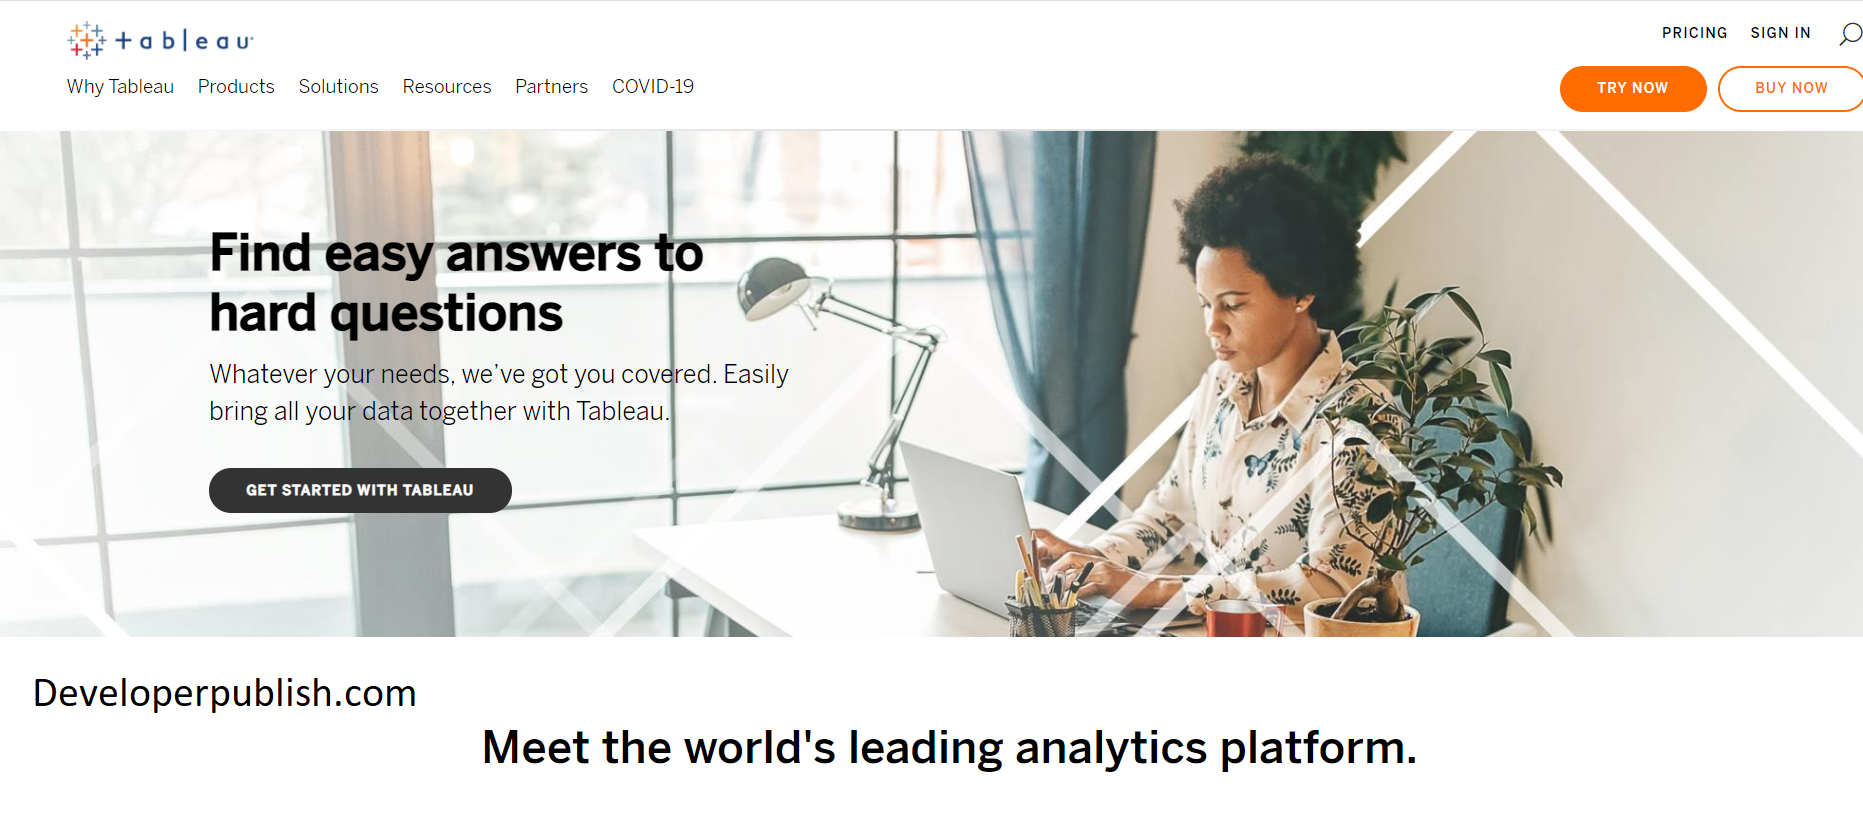
16.Tableau
Tableau is a downloadable desktop app takes your data and helps you create eye-catching visuals and contents. Numbers can be made into colorful, understandable and fun topics using tableau.
Check it here: https://www.tableau.com/
17.Tagul
Tagul creates delightful word clouds. Perfect for creating manifestoes, vision boards, subway art and more. You can customize the shape, layout and colors as well as the fonts and much more.

Check it here: https://wordart.com/create
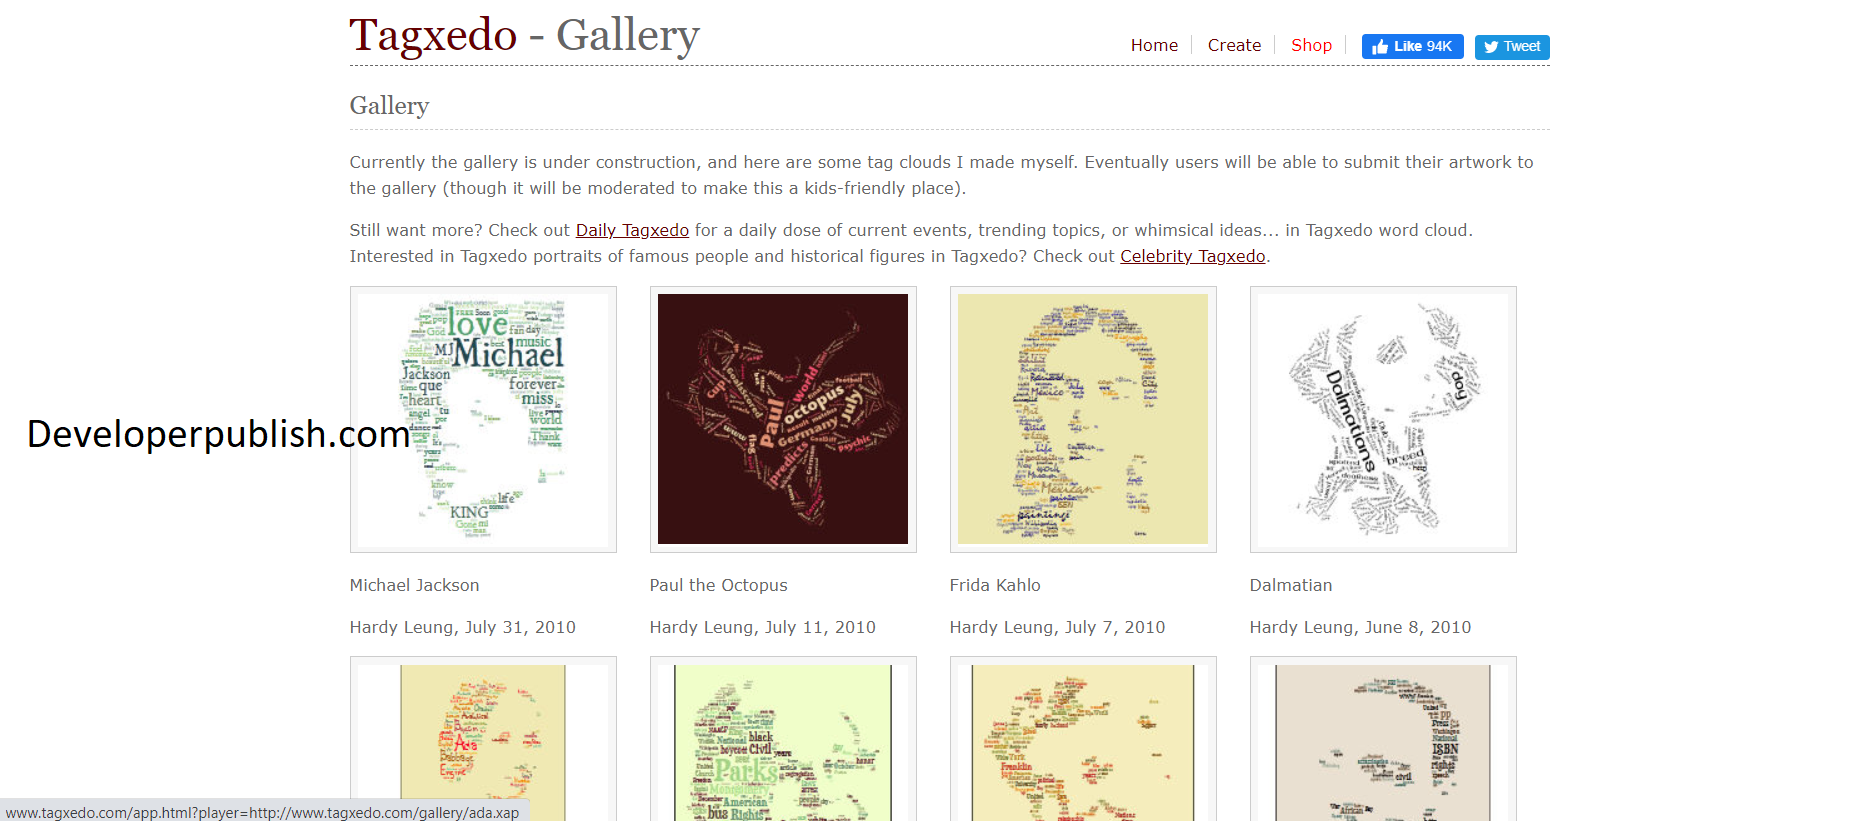
18.Tagxedo
Another fun word cloud tool, Tagxedo takes the best of Tagul and Wordle and bundles it into a tool that will turn words into art.
You can customize shapes, colors, fonts and you can also, turn any blog post, article or tweet into a word cloud.
Check it here: http://www.tagxedo.com/
19.Vizualize.Me
It is mostly used to create infographics about you for an interview and resume stuffs. It can also be used in the about me page on a website.
The free account comes with a limited number of templates and functionalities but really, even, they’re totally worth to work on and perfect if you’re on a budget but want catchy graphics.
Check it here: https://www.parchment.com/
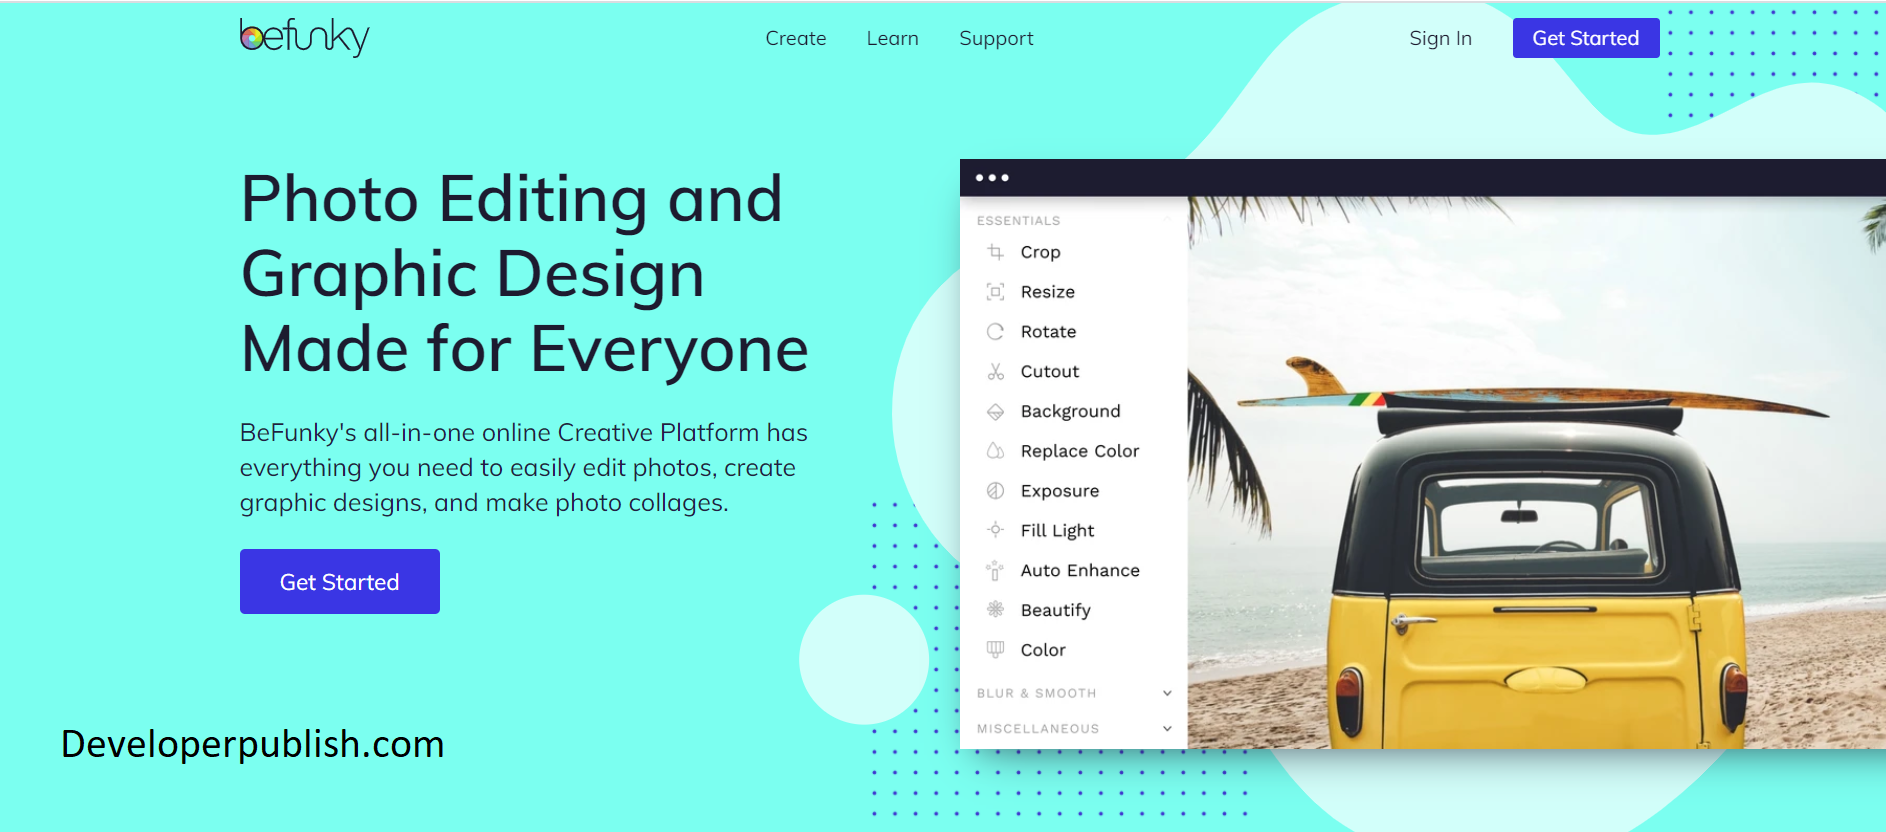
20. BeFunky
BeFunky is a tool to help freshers create professional looking designs and edit photographs with a professional touch. The infographic maker is with their design package and uses the same drag and drop interface as the rest of the tool.
Check it here: https://www.befunky.com/
And here we are with the top 20 tools for creating infographics from scratch. Check out our other blogs too.
Take a look at our infographics!here