FREQUENCY Function in excel
In this post, you will learn about FREQUENCY Function, its syntax and the way of using FREQUENCY Function in excel spreadsheet.
What is FREQUENCY Function?
FREQUENCY Function in excel is a statistical function. The FREQUENCY Function calculates values that occurs within the given range and returns a frequency distribution also gives multiple values and you should enter it as an array formula with Ctrl + Shift + Enter, except in Excel 365.
In Financial modelling, FREQUENCY Function calculates the frequency within the given data.
Syntax
=FREQUENCY(data_array, bins_array)
Arguments:
- = – built-in function.
- FREQUENCY() – function name.
- data_array – (Required) an array to count frequencies.
- bins_array – (Required) an array to interval, to group values in data_array.
Note:
- If data_array contains no value, returns 0.
- If bins_array contains no values, returns the number of elements in data_array.
- It ignores blank cells and text.
- FREQUENCY Function returns the number of array one more than the elements in bins_array.
- N/A error – if the array formula in a range of cells is too large.
Example; where the nth cell is the length of the bins_array+1.
- Formulas must be as an array formula.
For creating frequency distribution using FREQUENCY Function;
- Enter the numbers representing the bins(intervals), that we want to group.
- Confirm the size as the range that contains bins, or greater by one to include the extra item.
- Enter the FREQUENCY Function as an array formula using Ctrl + Shift + Enter.
How to use FREQUENCY Function in Excel?
FREQUENCY Function calculates and returns the frequency distribution.
Example:
Step 1:
Open the workbook in your Microsoft Excel.
Step 2:
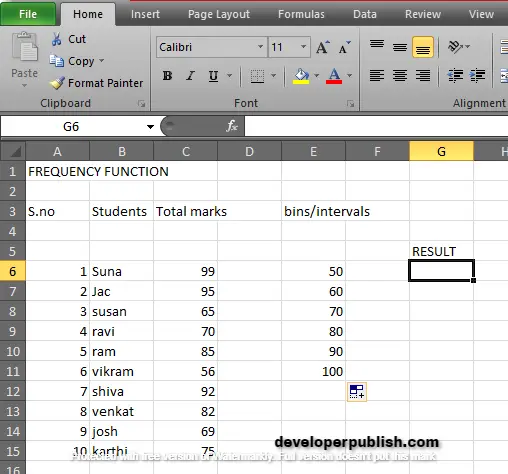
Enter the data, in the workbook.
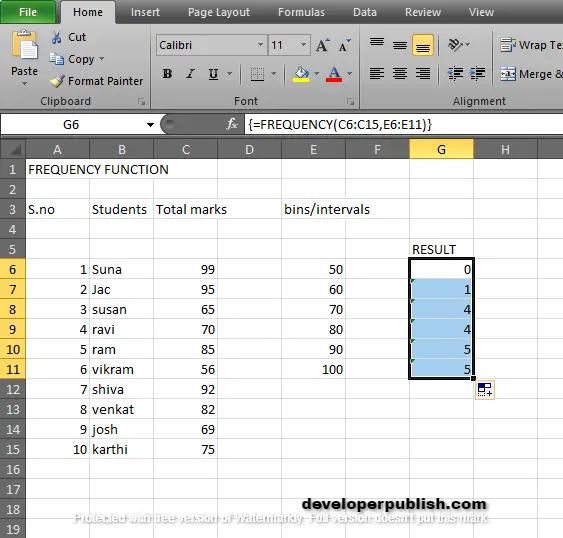
In this example, we can find the FREQUENCY Function by using student’s total marks.
STEP 3:
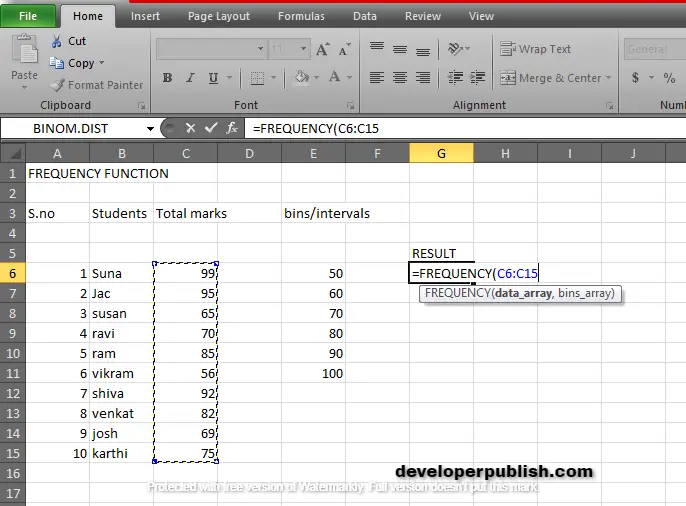
In the new cell, give the syntax. Start with ‘ =’ for every functions, FREQUENCY to initiate functions name, followed by open parenthesis.
According to the argument of the syntax, the first step is to calculate data_array; in this example, the data_array is student’s total marks, which is from C6:C15.
STEP 4:
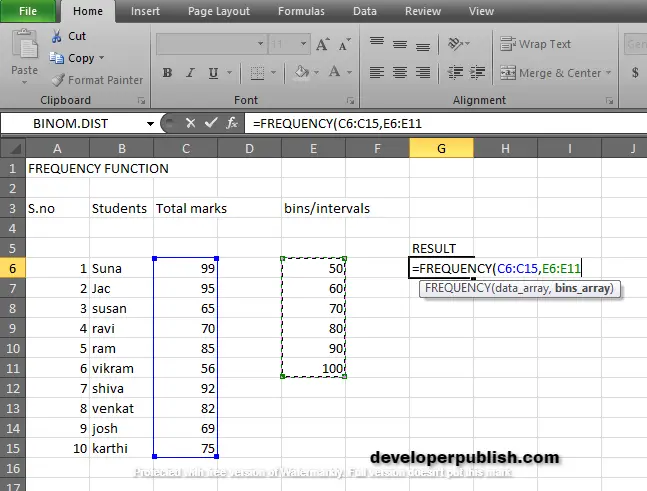
Keep a comma. Next is calculating bins_array argument.
Bins are also referred as an interval. The intervals are from 0-50, 50-60, 60-70, 70-80, 80-90, 90-100. Therefore the values are from E6: E11.
STEP 5:
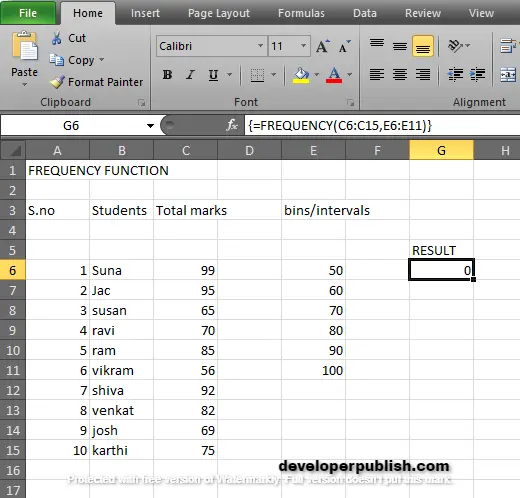
Since the given values are in the form of array formula, you should give Ctrl + Shift + Enter to get the calculated values.
Return 0, There is no value between 0-50.
STEP 6:
Drop and drag to get the remaining results.
Therefore, we got the results according to the frequencies of the intervals.


Leave a Review