Basics of Chart in Excel
This post explains to you the basics of the chart in Excel and how to create a simple chart in Microsoft Excel, also helps to change the chart types.
What is a Chart?
A chart is a tool in Excel that showcase your data graphically. Microsoft Excel provides different types of chart format to exhibit the database creatively. The different types of charts available in Excel are Bar, Column, Pie, Line, Area, Doughnut, Scatter, Surface, or Radar charts. It helps to know the variations and relation between the data. It also helps in understanding the meaning behind the numeric data.
How to Create a Simple Chart in Excel?
To create a chart in an Excel worksheet, follow the below-mentioned steps:
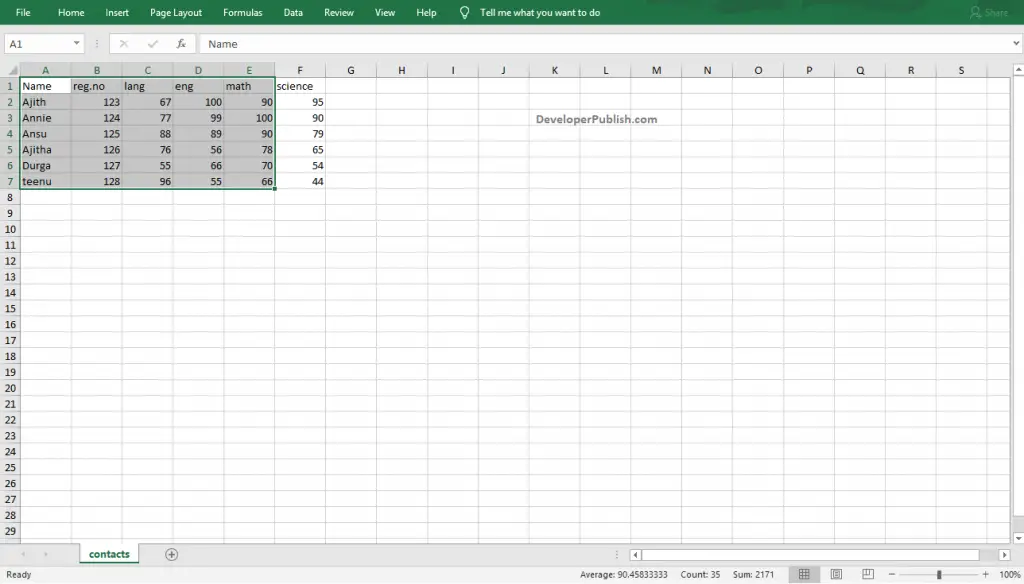
- Select the range of data that you want to include in your chart.
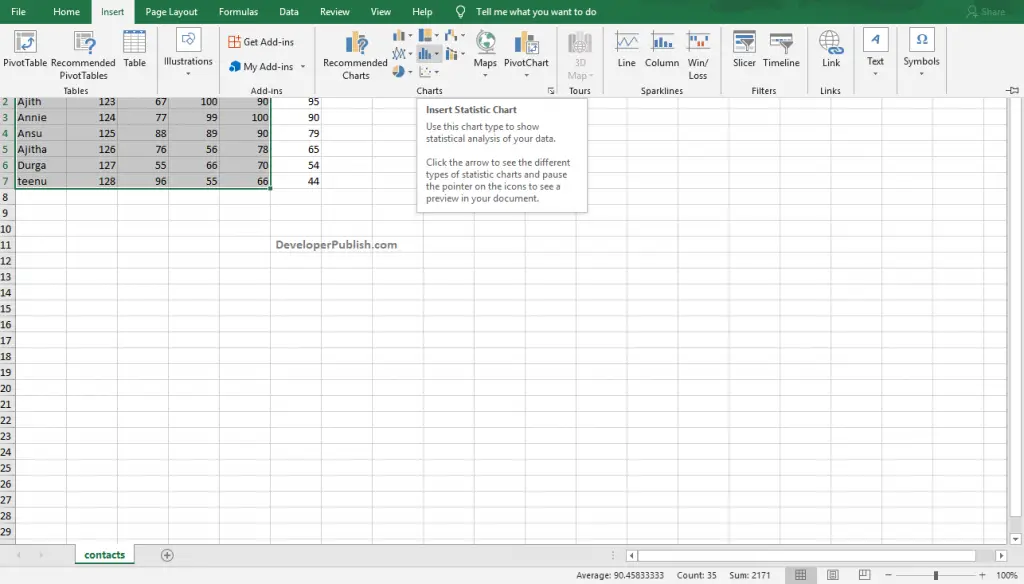
- Now, go to the Insert tab and select your desired type of chart from the Charts group.
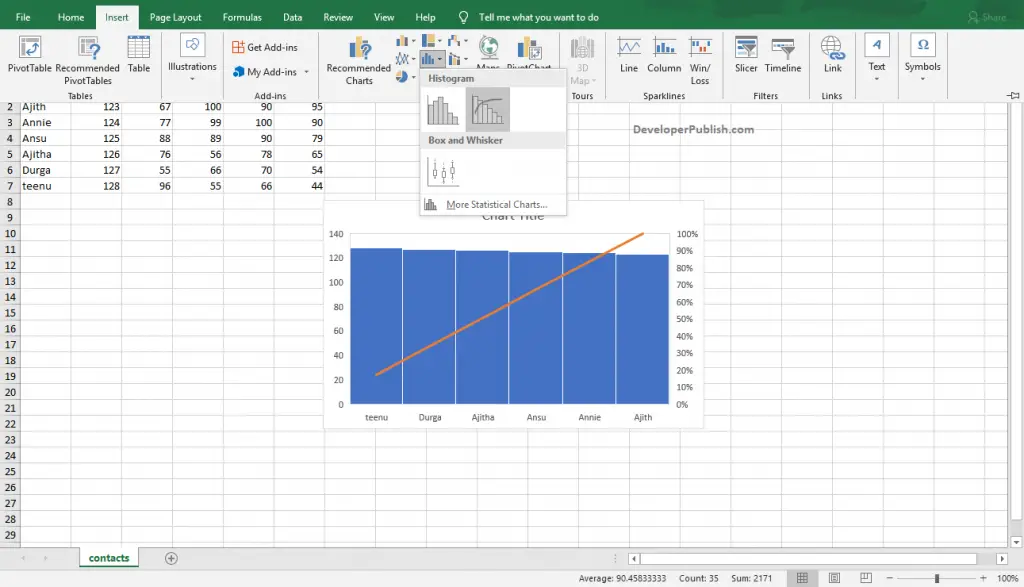
- Now, the below image shows the Statistics chart for the data selected.
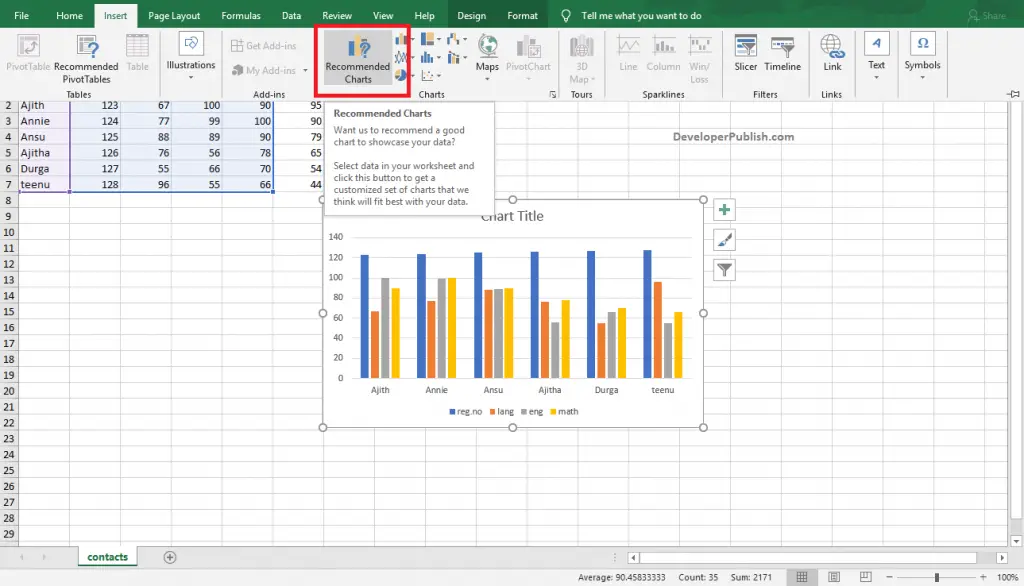
The Recommended Charts option in the Charts group helps you identify the suitable type of chart for the selected range of data.
How to Change the Chart type in Excel?
To change the chart type of an existing chart, follow the below-mentioned steps:
- Click anywhere on the chart area, you will get the Chart Tools.
- Go to the Design Tab, then click on the Change Chart Type option.
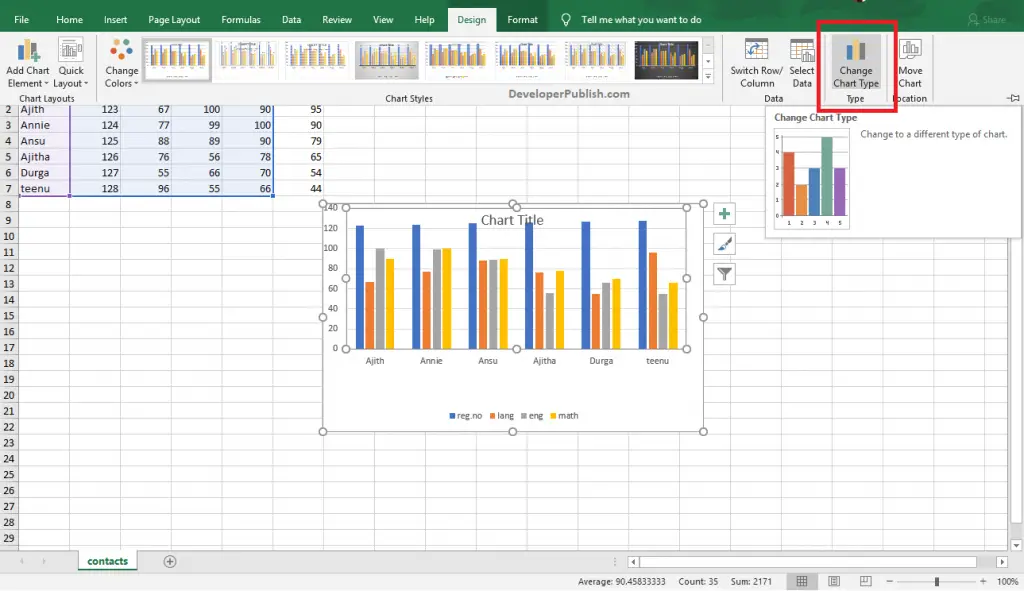
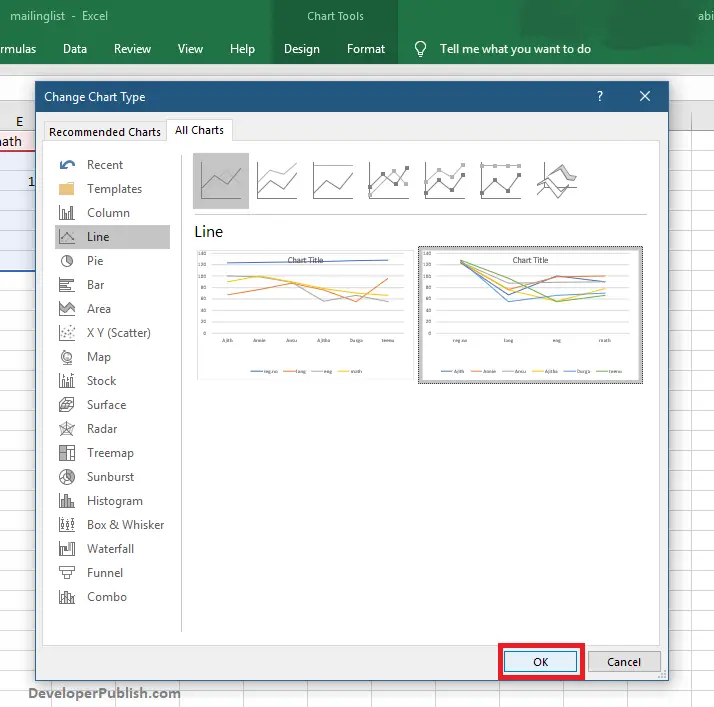
- The Change Chart Type dialogue box will appear on the screen as in the below image.
- Now, select the desired chart type you want to change with and click on the Ok button.
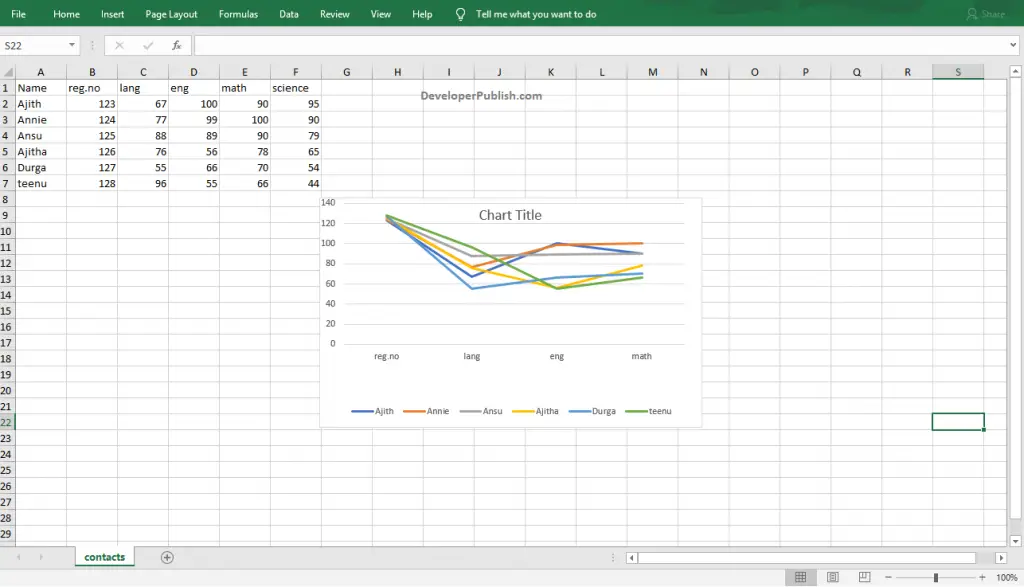
In the above image, you can see the changed Line Chart type..


Leave a Review