Sensitivity Analysis with Excel Solver
In this article you’ll get to know about Sensitivity Analysis in Excel. Sensitivity Analysis is a report which shows all the possible probabilities of the solution for a problem.
After you solve the problem, the Solver Results dialog box will open up. To get the Sensitivity Analysis click on Sensitivity in the Reports section.
Sensitivity Analysis in Excel
Let’s look at a problem, its aim is to maximize the flow. Solve it as how you will usually solve a problem using Solver tool in Excel.
After you solve the problem, the Solver Results dialog box opens up. To get the Sensitivity Analysis select the Sensitivity option under Reports and click on OK.
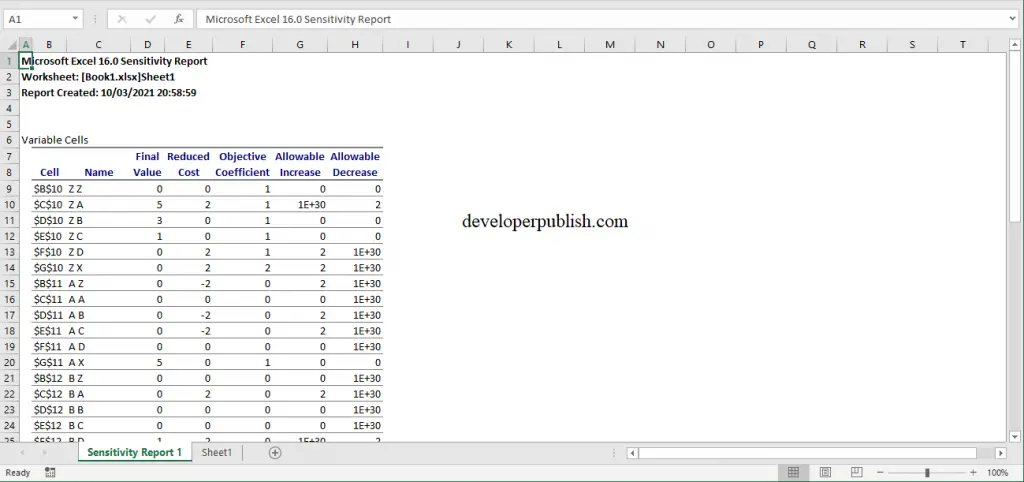
The Analysis gets displayed in an new worksheet.


Leave a Review