Performance and Diagnostics Tools for Universal App
Visual Studio 2013 Update 4 provides some useful tools for diagnosing the performance issues in the Universal App.
Performance and Diagnostics Tools for Universal App
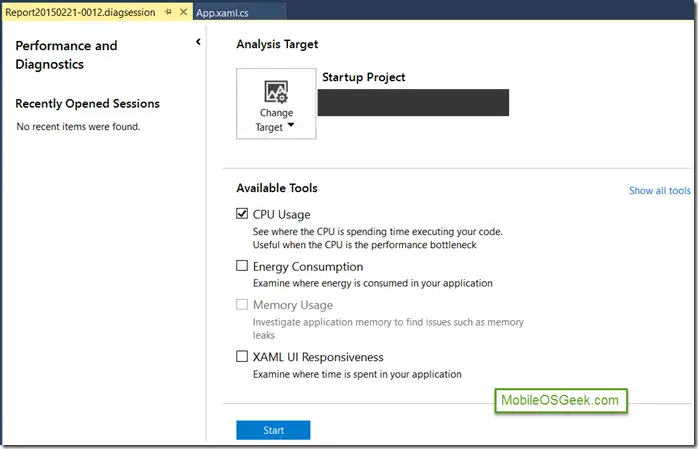
These performance and diagnostics tools include
- XAML UI Responsiveness
- CPU Usage
- Memory Usage
- Energy Consumption
These performance and diagnostics tools can be accessed by selecting the “Performance and Diagnostics” option from the Debug menu.
XAML UI Responsiveness
The XAML UI Responsiveness tool lets the developers to analyse where the time is spent within your application. This displays the performance cost of the UI element used in the pages.
CPU Usage
The CPU Usage tool lets the developers to perform profiling and identify where the CPU is spending time executing the code.
Memory Usage
The Memory Usage is yet another memory profiling tool which lets the developers to investigate application memory and identify memory leaks within your application.
Energy Consumption
The Energy Consumption tools lets the developers to identify how the energy is consumed within your application based on some of the parameters like CPU usage , network etc.


Leave a Review